|
Our
Strategic Plan is for investors interested in
trading once in a while.
-
+29% YTD.
-
In cash most of the time.
-
Only begin trading
5 minutes after the open.
-
This Strategy trades around long term
pivots only.
-
We do not fire
alerts. You need to know the rules.
-
We trade
two ETFs: DDM and DXD
-
Risk controls are
integral.
-
Designed for
1-3 month trades.
-
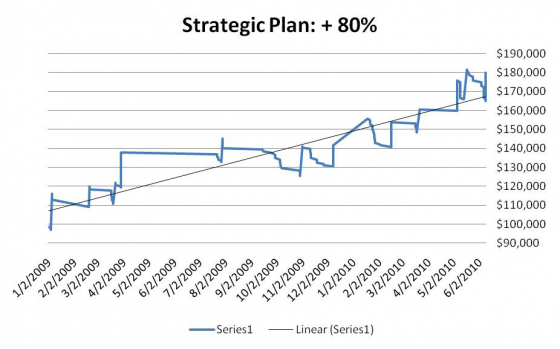
The graph below shows the growth of $100K in
this strategy.
The
Current Dow Parameters for the Strategic Plan are:
6485 - 9083 - 9904 - 10725 - 11724
Our Strategic Plan
averages a few trades per month. This is a
conversion strategy. That means it is a proactive
long/short strategy that will convert from short to
long, or from long to short, based on tests or breaks of
support or resistance levels. Those are our risk controls,
and they
are integral. Once the Market makes up its mind,
we ride it in either direction to secure gains.
The end results show a few small stops associated with a
much larger gain most of the time. This strategy is based on the Dow Jones Industrial
Average, and it trades DDM and DXD exclusively.
Although it can make money on the short side of the
market, it is never short anything because DXD is a
short ETF that we buy. That opens it to qualified
accounts.
Based on a strict set
of rules, this strategy has performed well over time.
Past performance is no
guarantee of future results.
Start here:
-
Learn how to
use the Strategic Plan
-
Review our current
strategic plan
-
How the Strategic Plan works with the Investment Rate
-
A Test to verify that you understand the Strategic Plan
-
Review the performance of the plan since 8.07
How to use the Strategic plan:
The Strategic Plan is
intended to be used in conjunction with our longer term
analysis. We use the Dow Jones Industrial Average for
Market Timing signals. With integrated risk controls,
our Strategic Plan is a proactive alternative to buy and
hold investments.
The strategy involves two
correlated ETFs. We use DDM and DXD to take advantage
of defined market cycles.
-
DDM is the double
weighted long Proshare representing the Dow Jones
Industrial Average.
-
DXD is the double
weighted short Proshare representing the Dow Jones
Industrial Average.
Our approach is refined to
simplify the process. When short signals surface, we
buy DXD. When long signals surface, we buy DDM.
We do not trade any other instruments, and we never actually
short anything. However, DXD is a built - in short, so
we do take advantage of downward market moves when they
occur. With that, the Strategic Plan can also be used
in IRAs.
There are two occasions in
which short signals present themselves, and two for long
signals as well:
-
We buy only when support
is tested, or when resistance breaks higher. (buy DDM)
-
We short only when
resistance is tested or when support breaks lower.
(buy DXD)
Entry levels are
restricted. The Dow must be within 25 points of a
respective support or resistance level in order to trigger a
new trade. A wider spread offsets our risk controls,
and makes them ineffective.
Risk Controls are integral.
We use 0.5% stop losses in these positions. If our
entry level is within 25 points of the stated parameter, the
0.5% stop should only trigger when that respective
parameter is breached. The 0.5% stop was chosen
because it correlates with our entry level
restriction of 25 points. They are
interrelated, and should be used together.
Conversion Strategies
are important to this model. For example, assume
support is tested and we buy DDM because the Market
is within 25 points of support. According to
rule, we would set a 0.5% stop loss in DDM.
If support breaks and that DDM position is stopped out with a 0.5% loss,
we revert immediately back to the rules.
Specifically, the 25 point rule should be observed.
If the Market is now under support but still within
25 points, we will buy DXD, set a 0.5% stop loss,
and observe the same set of rules. All we have
done is convert from long to short. We may
convert back and forth a number of times before
securing gains. In certain situations, we may
be stopped, and could re-enter the same position
because the rules tell us to. Therefore,
conversion is not automatic, but instead based on
the rules.
Exit Strategies are
based on one of two criteria. Either the targeted
support or resistance level must be officially tested, or
the gains from the ETF we have entered must be greater than
or equal to 10%.
-
Tests of support or
resistance require the market to be within 25 points of
support or resistance.
-
10% profits are based on
a reversal strategy. That means, we want to set a
profit stop to secure 10% in profits when we are holding
slightly more than 10%, and then let the position follow
through to the next support or resistance level
accordingly. However, if at any time the Market
reverses against us and the profit stop is triggered we
should willing accept the 10% lock in, and wait for the
next trading signal.
Early Exits occur when
we lock in gains before the targeted support or resistance
level is tested. This would only occur when we secure
10% in gains. However, this also requires an added
degree of patience. New trades are based on tests of
support or resistance, so if we lock in gains early new
trades may not happen for a while. New trades must not
be made in the middle of a channel. If that rule can
be respected, early exits can be rewarding because re-tests
of parameters occur regularly.
Trading Parameters are
focused on the Dow Jones Industrial Average, and they can be
found either by reviewing the longer term chart of the Dow,
or by reviewing our Strategic Plan page on a regular basis.
These are almost always part of our nightly emails as well.
The above rules should be
used in conjunction with our ongoing Strategic Plan
Our
Current Strategic Plan
After another stop, we ended in DDM again:
|
6/8/2010 |
DDM |
39.62 |
39.42 |
6/9/2010 |
-0.2 |
-0.50% |
|
6/9/2010 |
DXD |
30.56 |
30.4 |
6/9/2010 |
-0.16 |
-0.52% |
|
6/9/2010 |
DDM |
39.66 |
|
|
|
|
Updated 6.10.10
Set
a profit stop in DDM if the Market moves higher.
Specifically, if DDM hits $43.5, set a profit stop
at $43.25 and let it ride. Additional
instruction will be provided when it is required.
Updated 6.8.10:
We
converted to DDM.
|
6/7/2010 |
DXD |
30.62 |
30.46 |
6/8/2010 |
-0.16 |
-0.52% |
|
$40,337 |
DDM |
39.62 |
|
|
|
|
Updated 6.7.10:
We
ended the day in DXD. We were stopped a number
of times. This phase of the Strategic Plan has
turned out to be tough. More than anything
else, we were on the verge of securing gains just
two days ago, that is the toughest part.
However, we have now transitioned lower, and if the
Market declines we will make money again. This
has already happened once this year. I mean,
we have already had a challenging phase. That
was the second phase of the year. Even with
that, we are up nicely this year already. I
believe we will experience a similar result as that
last challenging phase. It requires a resolve,
and adherence to discipline.
|
6/7/2010 |
DDM |
39.84 |
39.64 |
6/7/2010 |
-0.2 |
-0.50% |
|
6/7/2010 |
DDM |
39.67 |
39.46 |
6/7/2010 |
-0.21 |
-0.53% |
|
6/7/2010 |
DXD |
30.6 |
30.44 |
6/7/2010 |
-0.16 |
-0.52% |
|
6/7/2010 |
DDM |
39.68 |
39.46 |
6/7/2010 |
-0.22 |
-0.55% |
|
6/7/2010 |
DXD |
30.64 |
30.46 |
6/7/2010 |
-0.18 |
-0.59% |
|
6/7/2010 |
DDM |
39.68 |
39.46 |
6/7/2010 |
-0.22 |
-0.55% |
|
6/7/2010 |
DXD |
30.62 |
|
|
|
|
Updated 6.6.10:
We
ended in cash. I do not see how anyone could
have re-entered DDM after the DXD stop. There
was less than 2 seconds left in the trading day
after the stop occurred. The stop should have
been executed, but re-entering DDM was impossible.
When the 25 point rule is satisfied again we will
take action according to rule.
|
5/25/2010 |
DDM |
39.86 |
39.65 |
6/4/2010 |
-0.21 |
-0.53% |
|
6/4/2010 |
DXD |
30.4 |
30.24 |
6/4/2010 |
-0.16 |
-0.53% |
|
6/4/2010 |
DDM |
39.82 |
39.62 |
6/4/2010 |
-0.2 |
-0.50% |
|
6/4/2010 |
DXD |
30.43 |
30.27 |
6/4/2010 |
-0.16 |
-0.53% |
Updated 5.27.10:
Set
a profit stop in DDM if the Market moves higher.
Specifically, if DDM hits $43.8, set a profit stop
at $43.51 and let it ride. Additional
instruction will be provided when it is required.
Updated 5.25.10:
After a few stops, we ended the day in DDM again:
|
5/21/2010 |
DDM |
39.86 |
39.2 |
5/25/2010 |
-0.66 |
-1.66% |
|
5/25/2010 |
DXD |
30.92 |
30.76 |
5/25/2010 |
-0.16 |
-0.52% |
|
5/25/2010 |
DXD |
30.77 |
30.61 |
5/25/2010 |
-0.16 |
-0.52% |
|
5/25/2010 |
DDM |
39.86 |
|
|
|
|
Updated 5.23.10
We
entered DDM on Friday when the Market tested 9904.
If
DDM gets to 43.8 set a profit stop at 43.7 and let
it ride.
Updated 5.20.10:
We
secured 9.52% from DXD. We are now in cash and
waiting for a new trading signals according to the
rules. Review the Strategic Plan Parameters
above and the Rules associated with them for
entries.
|
5/18/2010 |
DXD |
26.47 |
28.99 |
5/20/2010 |
2.52 |
9.52% |
$181,616 |
Updated 5.20.10:
If DXD gets to 29.1 set a profit stop at 28.99 and
let it ride.
This will secure 10% and give us the opportunity for
more if the Market continues to decline.
Updated 5.18.10:
We
stopped DXD and re-entered it. This is a
REVERSION strategy, not a conversion strategy.
If we are stopped, we revert to the rules.
That means, we respect the 25 point rule. This
time, we were stopped, but the Market was still
below 10725. As a result, we immediately
re-entered DXD. This is NOT a conversions
strategy, but instead it is a REVERSION streategy.
|
5/14/2010 |
DXD |
26.6 |
26.46 |
5/18/2010 |
-0.14 |
-0.53% |
|
5/18/2010 |
DXD |
26.47 |
|
|
|
|
Updated 5.14.10:
DDM
was stopped and we converted to DXD.
|
5/10/2010 |
DDM |
46.58 |
46.34 |
5/14/2010 |
-0.24 |
-0.52% |
|
5/14/2010 |
DXD |
26.6 |
|
|
|
|
Updated 5.12.10:
If
DDM hits $51.2 set a profit stop at $50.99 and let
it ride.
Updated 5.9.10:
After a series of stops, we ended in DDM:
|
5/10/2010 |
DDM |
46.87 |
46.62 |
5/10/2010 |
-0.25 |
-0.53% |
|
5/10/2010 |
DDM |
46.63 |
46.39 |
5/10/2010 |
-0.24 |
-0.51% |
|
5/10/2010 |
dxd |
26.65 |
26.51 |
5/10/2010 |
-0.14 |
-0.53% |
|
5/10/2010 |
ddm |
46.61 |
46.37 |
5/10/2010 |
-0.24 |
-0.51% |
|
5/10/2010 |
dxd |
26.67 |
26.53 |
5/10/2010 |
-0.14 |
-0.52% |
|
5/10/2010 |
ddm |
46.59 |
46.35 |
5/10/2010 |
-0.24 |
-0.52% |
|
5/10/2010 |
dxd |
26.7 |
26.56 |
5/10/2010 |
-0.14 |
-0.52% |
|
5/10/2010 |
ddm |
46.56 |
46.32 |
5/10/2010 |
-0.24 |
-0.52% |
|
5/10/2010 |
dxd |
26.68 |
26.53 |
5/10/2010 |
-0.15 |
-0.56% |
|
5/10/2010 |
ddm |
46.58 |
|
|
|
|
Updated 5.6.10:
There were two trades today, resulting in gains of
over 9%. We started by buying DDM near 10725,
we converted to DXD when it stopped, and we should
have also entered DDM near 9904, but that position
was impossible to fill. In fact, the fill
recorded for DXD is far off the level at which it
should have been filled, because the fast market
caused some of you to get very bad fills, and some
of you got executions like this, instead of over
$30. Still, the returns were good.
We
should be in cash, waiting for another trigger.
Soon, the Strategic Plan parameters may change, but
they remain as they are for now: 6485 - 9083 - 9904 - 10725 - 11724
|
5/6/2010 |
DDM |
46.85 |
46.6 |
5/6/2010 |
-0.25 |
-0.53% |
$153,610 |
|
5/6/2010 |
DXD |
26.78 |
29.45 |
5/6/2010 |
2.67 |
9.97% |
$163,580 |
Updated 4.27.10:
DDM
was closed near $50.66. We secured
approximately 8% and we are now in cash. We
should be waiting for the next test of either
support or resistance to occur before we take
action. Use the rules and the associated
parameters to identify trading signals.
Updated 4.26.10:
Sell DDM at market tomorrow after the Market opens.
DDM
hit $51.32 on Monday. The Market is very close
to turning lower according to our analysis, and it
could happen without the Dow testing longer term
resistance. This is because the Dow has been
lagging behind the other Markets. Therefore,
the profit stop plan needs to be adjusted.
Instead of waiting for $51.45 exactly, we should be
willing to sell now, just in case the Market turns
down without the test of longer term resistance that
would normally occur in the Dow too.
Our
revised plan is to sell @ Market on Tuesday morning,
move to cash, and revert to the rules. The
parameters for the Strategic Plan are not changing.
Expect an exact price to be shown tomorrow, in
tomorrow's update.
Updated 4.14.10:
If
DDM gets to $51.45 set a profit stop at $51.35 and
let it ride.
Updated 3.22.10:
We
converted into DDM:
|
3/19/2010 |
DXD |
27.14 |
27 |
3/22/2010 |
-0.14 |
-0.52% |
|
3/22/2010 |
DDM |
46.79 |
|
|
|
|
Updated 3.19.10:
We
converted into DXD:
|
3/18/2010 |
DDM |
46.8 |
46.56 |
3/19/2010 |
-0.24 |
-0.51% |
|
3/19/2010 |
DXD |
27.15 |
27.01 |
3/19/2010 |
-0.14 |
-0.52% |
|
3/19/2010 |
DDM |
46.81 |
46.56 |
3/19/2010 |
-0.25 |
-0.53% |
|
3/19/2010 |
DXD |
27.14 |
|
|
|
|
Updated 3.18.10:
We
transitioned to DDM
|
3/17/2010 |
DXD |
27.17 |
27.01 |
3/18/2010 |
-0.16 |
-0.59% |
|
3/18/2010 |
DDM |
46.8 |
|
|
|
|
Updated 3.17.10
We
ended the day long DXD. Here are the series of
trades:
|
3/17/2010 |
DXD |
27.17 |
27.03 |
3/17/2010 |
-0.14 |
-0.52% |
|
3/17/2010 |
DDM |
46.79 |
46.55 |
3/17/2010 |
-0.24 |
-0.51% |
|
3/17/2010 |
DXD |
27.17 |
|
|
|
|
Updated 3.16.10:
DDM
was sold for a net gain of 9.34%. We are now
in cash and waiting for a new trading signal based
on the established rules and related parameters.
|
2/16/2010 |
DDM |
42.06 |
45.99 |
3/16/2010 |
3.93 |
9.34% |
$149,568 |
Updated 3.1.10:
The
parameters for the strategic plan have been updated,
and profit stop rules for the current DDM position
have been offered in this update.
The
new parameters for the Strategic Plan are:
6485 - 9083 - 9904 - 10725 - 11724
We
are currently holding DDM. If you are not, and
you want to participate in the next phase of the
Strategic Plan, expect to do so at 10725. Use
the rules outlined above to guide your trades.
However, if you are holding DDM already, instead of
initiating new trades around 10725, start by setting
a profit stop in DDM if it breaks above $46 instead.
Specifically, if DDM breaks above $46.1 set a profit
stop at $45.99 and let it ride from there.
Only if it stops, convert to the rules outlined
above for new trades.
Updated 2.16.10.
We
were stopped out of DXD, but the Market was still
under 10200 when that happened. That caused a
re-trigger according to rule. However, that
stopped as well, and we transitioned to DDM.
We should be holding DDM as follows, with
the risk controls outlined above in place:
|
2/4/2010 |
DXD |
30.55 |
30.38 |
2/16/2010 |
-0.17 |
|
2/16/2010 |
DXD |
30.4 |
30.24 |
2/16/2010 |
-0.16 |
|
2/16/2010 |
DDM |
42.06 |
|
|
|
Updated 2.4.10:
This phase of the Strategic Plan has been rough.
At least, it has thus far. The trades are
listed below.
We
are currently holding DXD with about 3.5% in paper
gains. Because the Market is capable of
declining aggressively, we need to develop an exit
plan now. This is based on our 10% lock rule.
This is what we will do:
If
DXD gets to $33.55 we will place a profit stop at
$33.4 and let that ride. If it stops, we will
secure gains and move to cash. If the stock
moves higher, we will adjust the profit stop higher
according to updates offered in the nightly
newsletter and on this page.
If
the Market reverses higher before we secure gains,
we will convert higher again by rule.
Here are the trades from this phase thus far:
|
1/19/2010 |
DXD |
27.74 |
30.5 |
1/22/2010 |
2.76 |
9.95% |
$150,215 |
|
1/22/2010 |
DDM |
42.04 |
41.8 |
1/22/2010 |
-0.24 |
-0.57% |
$149,645 |
|
1/22/2010 |
DXD |
30.66 |
30.28 |
1/25/2010 |
-0.38 |
-1.24% |
$148,405 |
|
1/25/2010 |
DDM |
42.16 |
41.94 |
1/25/2010 |
-0.22 |
-0.52% |
$147,883 |
|
1/25/2010 |
DXD |
30.57 |
30.41 |
1/25/2010 |
-0.16 |
-0.52% |
$147,360 |
|
1/25/2010 |
DDM |
42.15 |
41.94 |
1/25/2010 |
-0.21 |
-0.50% |
$146,862 |
|
1/25/2010 |
DXD |
30.55 |
30.39 |
1/26/2010 |
-0.16 |
-0.52% |
$146,338 |
|
1/26/2010 |
DDM |
42.17 |
41.92 |
1/26/2010 |
-0.25 |
-0.59% |
$145,745 |
|
1/26/2010 |
DXD |
30.56 |
30.4 |
1/27/2010 |
-0.16 |
-0.52% |
$145,222 |
|
1/27/2010 |
DDM |
42.16 |
41.91 |
1/28/2010 |
-0.25 |
-0.59% |
$144,629 |
|
1/27/2010 |
DXD |
30.55 |
30.38 |
1/27/2010 |
-0.17 |
-0.56% |
$144,072 |
|
1/27/2010 |
DDM |
42.18 |
41.94 |
1/28/2010 |
-0.24 |
-0.57% |
$143,503 |
|
1/28/2010 |
DXD |
30.56 |
30.39 |
1/28/2010 |
-0.17 |
-0.56% |
$142,947 |
|
1/28/2010 |
DDM |
42.15 |
41.9 |
1/28/2010 |
-0.25 |
-0.59% |
$142,354 |
|
1/28/2010 |
DXD |
30.54 |
30.38 |
2/1/2010 |
-0.16 |
-0.52% |
$141,830 |
|
2/1/2010 |
DDM |
42.1 |
41.88 |
2/4/2010 |
-0.22 |
-0.52% |
$141,307 |
|
2/4/2010 |
DXD |
30.55 |
|
|
|
|
|
Updated 1.28.10:
We
ended the session holding DXD:
|
1/27/2010 |
DDM |
42.16 |
41.91 |
1/28/2010 |
-0.25 |
-0.59% |
|
1/28/2010 |
DXD |
30.55 |
|
|
|
|
Updated 1.27.10:
We
held a webinar today discussing the Strategic Plan.
The notion is, if we can remove the stupid human
restrictions we impose on ourselves, this strategy
can work for us over time. It is simple, and
maybe too simple. We will have more losses
than gains, but the gains outweigh the losses, and
over time we have excelled. This is a Tortoise
vs Hare Strategy. It has shattered Market
performance in the past. It works, but it
requires users to follow the strategy appropriately,
not selectively.
|
1/26/2010 |
DXD |
30.56 |
30.4 |
1/27/2010 |
-0.16 |
-0.52% |
|
1/27/2010 |
DDM |
42.16 |
|
|
|
|
We
are holding DDM with strict risk controls in place.
Updated 1.26.10:
We
had a couple stops. We were holding nice
intraday gains in DDM, but the late day reversal on
Tuesday stopped us out of DDM, and we ended the day
holding DXD again.
|
1/25/2010 |
DXD |
30.55 |
30.39 |
1/26/2010 |
-0.16 |
-0.52% |
|
1/26/2010 |
DDM |
42.17 |
41.92 |
1/26/2010 |
-0.25 |
-0.59% |
|
1/26/2010 |
DXD |
30.56 |
|
|
|
|
Updated 1.25.10:
We
were stopped a few times, the first time for a
larger than expected loss. We ended the
session holding DXD with strict risk controls in
place.
|
1/22/2010 |
DXD |
30.66 |
30.28 |
1/25/2010 |
-0.38 |
-1.24% |
|
1/25/2010 |
DDM |
42.16 |
41.94 |
1/25/2010 |
-0.22 |
-0.52% |
|
1/25/2010 |
DXD |
30.57 |
30.41 |
1/25/2010 |
-0.16 |
-0.52% |
|
1/25/2010 |
DDM |
42.15 |
41.94 |
1/25/2010 |
-0.21 |
-0.50% |
|
1/25/2010 |
DXD |
30.55 |
|
|
|
|
Updated 1.24.10:
We
secured 9.95% in DXD, then attempted to buy the test
of 10200. That failed, 10200 broke, and we
converted back to DXD according to rule. We
are currently holding DXD with strict risk controls
in place.
|
DXD |
30.54 |
30.38 |
9-Dec |
-0.16 |
-0.52% |
$131,728 |
|
DDM |
42.75 |
46.4 |
1/19/2010 |
3.65 |
8.54% |
$140,266 |
|
DXD |
27.74 |
30.5 |
1/22/2010 |
2.76 |
9.95% |
$150,215 |
|
DDM |
42.04 |
41.8 |
1/22/2010 |
-0.24 |
-0.57% |
$149,645 |
|
DXD |
30.66 |
|
|
|
|
|
The
Dow Parameters for the Strategic Plan are:
5300 - 6485 - 9083 - 10200 - 10750 - 11724
Updated 1.21.09:
We are holding DXD
from 10750 (entry was near $27.74).
10200 is our
support inflection parameter. If 10200 is
tested, take profits in DXD. I estimate, we
will secure gains at about $30.50 if 10200 is
tested. That will be very close to our usual
10% goal for securing gains in the Strategic
Plan. We will not use profit stops this time.
Instead, if/when 10200 is tested, we will take
profits, and then we will start the next phase.
Ahead of the
Curve:
In addition, if
you are late, and getting excited about trading
this market, realize something. You cannot
trade effectively behind the curve. If you try,
you will not be able to use risk controls
effectively. Being ahead of the curve is
important. The Market has already fallen hard
from our entry. New entries here are
effectively behind the curve.
Updated 1.19.10
10750 was tested, we secured 8.54% in gains, we
closed DDM, and we are now in DXD according to rule.
|
11/2/2009 |
DXD |
34.87 |
34.69 |
2-Nov |
-0.18 |
-0.52% |
$139,122 |
|
11/11/2009 |
DXD |
30.72 |
30.56 |
12-Nov |
-0.16 |
-0.52% |
$138,602 |
|
11/11/2009 |
DDM |
42.77 |
42.55 |
11-Nov |
-0.22 |
-0.51% |
$138,087 |
|
11/11/2009 |
DXD |
30.67 |
30.51 |
11-Nov |
-0.16 |
-0.52% |
$137,566 |
|
11/12/2009 |
DXD |
30.71 |
30.46 |
19-Nov |
-0.25 |
-0.81% |
$136,752 |
|
11/12/2009 |
DDM |
42.72 |
42.5 |
12-Nov |
-0.22 |
-0.51% |
$136,237 |
|
11/12/2009 |
DXD |
30.71 |
30.55 |
12-Nov |
-0.16 |
-0.52% |
$135,716 |
|
11/12/2009 |
DDM |
42.73 |
42.51 |
12-Nov |
-0.22 |
-0.51% |
$135,201 |
|
11/19/2009 |
DDM |
42.66 |
42.32 |
27-Nov |
-0.34 |
-0.80% |
$134,404 |
|
11/19/2009 |
DXD |
30.73 |
30.56 |
19-Nov |
-0.17 |
-0.55% |
$133,850 |
|
11/19/2009 |
DDM |
42.72 |
42.5 |
19-Nov |
-0.22 |
-0.51% |
$133,335 |
|
11/27/2009 |
DDM |
42.64 |
42.4 |
9-Dec |
-0.24 |
-0.56% |
$132,773 |
|
11/27/2009 |
DXD |
30.72 |
30.56 |
27-Nov |
-0.16 |
-0.52% |
$132,252 |
|
12/9/2009 |
DXD |
30.54 |
30.38 |
9-Dec |
-0.16 |
-0.52% |
$131,728 |
|
12/9/2009 |
DDM |
42.75 |
46.4 |
1/19/2010 |
3.65 |
8.54% |
$140,266 |
|
1/19/2010 |
DXD |
27.74 |
|
|
|
|
|
Updated 12.7.09:
The
Strategic Plan parameters have changed. Find
them below.
If
10750 is tested, we should sell DDM.
5300 - 6485 - 9083 - 10290 - 10750 - 11724
Updated 12.2.09:
We
should be long DDM:
|
YTD Return: |
Strategic |
Plan = |
39.12% |
|
|
|
|
|
|
|
|
Enter date |
ETF |
Enter price |
Exit price |
Exit Date |
|
|
|
|
|
|
|
|
|
|
|
|
|
|
|
|
|
|
|
27-Nov |
DDM |
42.64 |
|
|
|
27-Nov |
DXD |
30.72 |
30.56 |
27-Nov |
|
19-Nov |
DDM |
42.66 |
42.32 |
27-Nov |
|
19-Nov |
DXD |
30.73 |
30.56 |
19-Nov |
|
19-Nov |
DDM |
42.72 |
42.5 |
19-Nov |
|
12-Nov |
DXD |
30.71 |
30.46 |
19-Nov |
|
12-Nov |
DDM |
42.72 |
42.5 |
12-Nov |
|
12-Nov |
DXD |
30.71 |
30.55 |
12-Nov |
|
12-Nov |
DDM |
42.73 |
42.51 |
12-Nov |
|
11-Nov |
DXD |
30.72 |
30.56 |
12-Nov |
|
11-Nov |
DDM |
42.77 |
42.55 |
11-Nov |
|
11-Nov |
DXD |
30.67 |
30.51 |
11-Nov |
Updated 11.22.09:
We
should be long DDM:
|
YTD Return: |
Strategic |
Plan = |
39.12% |
|
|
|
|
|
|
|
|
Enter date |
ETF |
Enter price |
Exit price |
Exit Date |
|
|
|
|
|
|
|
|
|
|
|
|
|
|
|
|
|
|
|
19-Nov |
DDM |
42.66 |
|
|
|
19-Nov |
DXD |
30.73 |
30.56 |
|
|
19-Nov |
DDM |
42.72 |
42.5 |
|
|
12-Nov |
DXD |
30.71 |
30.46 |
|
|
12-Nov |
DDM |
42.72 |
42.5 |
|
|
12-Nov |
DXD |
30.71 |
30.55 |
|
|
12-Nov |
DDM |
42.73 |
42.51 |
|
|
11-Nov |
DXD |
30.72 |
30.56 |
|
|
11-Nov |
DDM |
42.77 |
42.55 |
|
|
11-Nov |
DXD |
30.67 |
30.51 |
|
Updated 11.16.09:
DXD
stopped, but we did not have enough time to enter
DDM. We should be in cash and ready to trigger
again upon the next test of support or resistance.
|
12-Nov |
DXD |
30.71 |
30.46 |
|
12-Nov |
DDM |
42.72 |
42.5 |
|
12-Nov |
DXD |
30.71 |
30.55 |
|
12-Nov |
DDM |
42.73 |
42.51 |
|
11-Nov |
DXD |
30.72 |
30.56 |
|
11-Nov |
DDM |
42.77 |
42.55 |
|
11-Nov |
DXD |
30.67 |
30.51 |
Updated 11.12.09:
We
should be holding DXD:
|
12-Nov |
DXD |
30.71 |
|
|
|
|
|
12-Nov |
DDM |
42.72 |
42.5 |
|
|
|
|
12-Nov |
DXD |
30.71 |
30.55 |
|
|
|
|
12-Nov |
DDM |
42.73 |
42.51 |
|
|
|
|
11-Nov |
DXD |
30.72 |
30.56 |
|
|
|
|
11-Nov |
DDM |
42.77 |
42.55 |
|
|
|
|
11-Nov |
DXD |
30.67 |
30.51 |
|
|
|
Updated 11.11.09:
We
should currently be holding DXD.
5300 - 6524 - 8051 -
9683 - 10290 - 10745
If
10290 holds, expect 9683. Otherwise, if 10290
breaks higher and we convert, expect 10745 instead.
|
YTD Return: |
Strategic |
Plan = |
39.12% |
|
|
|
|
|
|
|
|
|
|
|
|
Enter date |
ETF |
Enter price |
Exit price |
Exit Date |
Difference |
% return |
|
|
|
|
|
|
|
|
|
|
|
|
|
|
|
|
|
11-Nov |
DXD |
30.72 |
|
|
|
|
|
11-Nov |
DDM |
42.77 |
42.55 |
|
|
|
|
11-Nov |
DXD |
30.67 |
30.51 |
|
|
|
Updated 11.11.09:
After the last series of stops, I expected this
phase of the Strategic plan to have been a losing
one. However, we came out with only a few
bruises. We made less than 1% in the last
phase. We locked in 12% in gains, but we were
carrying losses that offset the gains. Those
losses increased quite a bit in recent days, when
the Market fell back to 9728. That was not a
good inflection parameter at the time, so I changed
it, and saved us another round of stops. If
more stops happened, this may just have been a
losing phase.
In
any respect, to the most recent phase, I am glad to
see you go.
With that said, if this is as hard as it gets, it
really isn't that bad is it? If you are
comparing the results to the Market, you should not
be doing that. The results of one phase does
not define this strategy. If you choose to
compare market returns, use 2008, and the complete
year 2009. Clearly, the Strategic Plan is far
ahead of the Market. The Strategic Plan is
completely unrelated to market returns. It
works when the Market falls too. That is why
it is appropriate.
I
do not consider this a bad phase of the Strategic
Plan, but it did take more patience than we have
been used to this year. It actually worked
well on the basis of wealth preservation, with
opportunities coming second. Still, over time,
the result have been there.
Here are all the trades from the last round:
|
YTD Return: |
Strategic |
Plan = |
39.12% |
|
|
|
|
|
|
|
|
|
|
|
|
Enter date |
ETF |
Enter price |
Exit price |
Exit Date |
Difference |
% return |
|
|
|
|
|
|
|
|
|
|
|
|
|
|
|
|
|
2-Nov |
DDM |
37.81 |
42.6 |
11-Nov |
4.79 |
12.67% |
|
2-Nov |
DXD |
34.87 |
34.69 |
2-Nov |
-0.18 |
-0.52% |
|
30-Oct |
DDM |
38.06 |
37.64 |
2-Nov |
-0.42 |
-1.10% |
|
30-Oct |
DXD |
34.66 |
34.48 |
30-Oct |
-0.18 |
-0.52% |
|
30-Oct |
DDM |
38.06 |
37.81 |
30-Oct |
-0.25 |
-0.66% |
|
30-Oct |
DXD |
34.69 |
34.51 |
30-Oct |
-0.18 |
-0.52% |
|
30-Oct |
DDM |
38.05 |
37.82 |
30-Oct |
-0.23 |
-0.60% |
|
8-Oct |
DDM |
38.25 |
38.06 |
30-Oct |
-0.19 |
-0.50% |
|
7-Oct |
DXD |
34.87 |
34.43 |
8-Oct |
-0.44 |
-1.26% |
|
7-Oct |
DXD |
35.05 |
34.85 |
7-Oct |
-0.2 |
-0.57% |
|
6-Oct |
DDM |
38.03 |
37.81 |
7-Oct |
-0.22 |
-0.58% |
|
6-Oct |
DXD |
35.05 |
34.87 |
6-Oct |
-0.18 |
-0.51% |
|
6-Oct |
DDM |
38.02 |
37.82 |
6-Oct |
-0.2 |
-0.53% |
|
30-Sep |
DXD |
35.07 |
34.89 |
6-Oct |
-0.18 |
-0.51% |
|
30-Sep |
DDM |
38.16 |
37.95 |
30-Sep |
-0.21 |
-0.55% |
|
30-Sep |
DXD |
34.87 |
34.67 |
30-Sep |
-0.2 |
-0.57% |
|
28-Sep |
DDM |
38.16 |
37.96 |
30-Sep |
-0.2 |
-0.52% |
|
24-Sep |
DXD |
35.08 |
34.9 |
28-Sep |
-0.18 |
-0.51% |
|
16-Sep |
DDM |
38.23 |
38.03 |
24-Sep |
-0.2 |
-0.52% |
|
15-Sep |
DXD |
35.26 |
35.08 |
16-Sep |
-0.18 |
-0.51% |
Updated 11.09.09:
We
are currently holding approximately 11% in gains
from our November 2nd entry.
Set
a profit stop at $41.5. If it hits, sell DDM
and revert back to the rules. Otherwise, sell
at 10290. 10290 is the next inflection point.
If it is tested sell DDM, secure gains, and revert
to the rules.
The
only derivation to this would come if the Market
opens above 10290 on Tuesday. That does not
appear likely to happen, but if it does 10290 would
be our profit stop threshold. IE, we would
hold DDM unless it breaks. More will be said
on this subject if the Market seems to be starting
with a gap higher Tuesday.
Here
is the data array:
5300 - 6524 - 8051 -
9683 - 10290 - 10745
Updated 11.4.09:
In
the last few days we have been stopped a few times
in a row. I adjusted the parameters so that
9683 is now the trigger point. That reduced
our entries a little bit. My effort is to put
a halt to the choppiness around 9728. There
was a number of stops on October 30th. This
adjustment should reconcile that.
I
also realize we were holding approximately 7.5% in
gains when i issued my Top of the Market report on
October 22nd. However, we never reached the
10% threshold. The result was a stop.
Here are the trades:
|
YTD Return: |
Strategic |
Plan = |
38.03% |
|
|
|
|
|
|
|
0 |
|
|
|
|
Enter date |
ETF |
Enter price |
Exit price |
Exit Date |
Difference |
% return |
|
|
|
|
|
|
|
|
|
|
|
|
|
|
|
|
|
|
|
|
|
|
|
|
|
|
|
|
|
|
|
|
|
2-Nov |
DDM |
37.81 |
|
|
|
|
|
2-Nov |
DXD |
34.87 |
34.69 |
2-Nov |
|
|
|
30-Oct |
DDM |
38.06 |
37.64 |
2-Nov |
|
|
|
30-Oct |
DXD |
34.66 |
34.48 |
30-Oct |
|
|
|
30-Oct |
DDM |
38.06 |
37.81 |
30-Oct |
|
|
|
30-Oct |
DXD |
34.69 |
34.51 |
30-Oct |
|
|
|
30-Oct |
DDM |
38.05 |
37.82 |
30-Oct |
|
|
|
8-Oct |
DDM |
38.25 |
38.06 |
30-Oct |
|
|
|
7-Oct |
DXD |
34.87 |
34.43 |
8-Oct |
|
|
|
7-Oct |
DXD |
35.05 |
34.85 |
7-Oct |
|
|
|
6-Oct |
DDM |
38.03 |
37.81 |
7-Oct |
|
|
|
6-Oct |
DXD |
35.05 |
34.87 |
6-Oct |
|
|
|
6-Oct |
DDM |
38.02 |
37.82 |
6-Oct |
|
|
|
30-Sep |
DXD |
35.07 |
34.89 |
6-Oct |
|
|
|
30-Sep |
DDM |
38.16 |
37.95 |
30-Sep |
|
|
|
30-Sep |
DXD |
34.87 |
34.67 |
30-Sep |
|
|
|
28-Sep |
DDM |
38.16 |
37.96 |
30-Sep |
|
|
|
24-Sep |
DXD |
35.08 |
34.9 |
28-Sep |
|
|
|
16-Sep |
DDM |
38.23 |
38.03 |
24-Sep |
|
|
|
15-Sep |
DXD |
35.26 |
35.08 |
16-Sep |
|
|
Updated 10.31.09:
We
were close to a 'lock' in the Strategic Plan, but
the sudden reversal in the Market has caused us to
be stopped again around 9728. Although the
Market seemed to respect it as a longer term
inflection parameter before, and we almost secured
10%. we must reconsider it as an inflection
parameter. After doing so, I concluded that a
slightly lower level is more appropriate as
inflection at this time. I have revised the
parameters down accordingly. Find the revised
parameters below.
This is how we will handle 9728: We should
have DDM. This was based on 9728. Because we
lowered it to 9683, we need to widen the stop on
this position slightly. Because of this
change, lower the stop on DDM to execute if the Dow
hits 9680. If it does, stop DDM and revert
back to the rules. If it does not get there,
expect aggressively higher levels over time.
If
you were smart enough to close out the last position
when I issued my Top of the Market report on
10.22.09, you should use 9683 as inflection, and a
trigger point for the Strategic Plan.
Dow parameters for Strategic Plan:
5300 - 6524 - 8051 -
9683 - 10290 - 10745
Updated 10.22.09:
The top of the Market is near:
http://stocktradersdaily.com/top2/top2/top2.htm
Updated 10.19.09:
Three possible scenarios:
-
If DDM gets to
$42.07 set a profit stop at $41.99 and let it
ride.
-
If DDM breaks
above $42.07 and the Market tests 10400 without
DDM stopping, sell DDM when 10400 is tested and
revert to the rules.
-
If the market
breaks down instead, stop DDM according to stop
loss rule that is in place now.
Updated 10.8.09
We
experienced a larger than usual stop, and then
re-entered DDM.
We
should be holding DDM.
|
8-Oct |
DDM |
38.25 |
|
|
|
7-Oct |
DXD |
34.87 |
34.43 |
8-Oct |
|
7-Oct |
DXD |
35.05 |
34.85 |
7-Oct |
|
6-Oct |
DDM |
38.03 |
37.81 |
7-Oct |
|
6-Oct |
DXD |
35.05 |
34.87 |
6-Oct |
|
6-Oct |
DDM |
38.02 |
37.82 |
6-Oct |
|
30-Sep |
DXD |
35.07 |
34.89 |
6-Oct |
|
30-Sep |
DDM |
38.16 |
37.95 |
30-Sep |
|
30-Sep |
DXD |
34.87 |
34.67 |
30-Sep |
|
28-Sep |
DDM |
38.16 |
37.96 |
30-Sep |
|
24-Sep |
DXD |
35.08 |
34.9 |
28-Sep |
|
16-Sep |
DDM |
38.23 |
38.03 |
24-Sep |
|
15-Sep |
DXD |
35.26 |
35.08 |
16-Sep |
Updated 10.7.09:
A
couple more stops occurred on Wednesday. This
was unusual though. At 10:18 AM Et a stop
occurred when we were in DXD, but the Market was
still under 9728. That meant we had to
re-enter DXD again according to rule, and not
convert to DDM. That is why there are two DXD
trades in a row.
We
should be holding DXD.
|
7-Oct |
DXD |
34.87 |
|
|
|
7-Oct |
DXD |
35.05 |
34.85 |
7-Oct |
|
6-Oct |
DDM |
38.03 |
37.81 |
7-Oct |
|
6-Oct |
DXD |
35.05 |
34.87 |
6-Oct |
|
6-Oct |
DDM |
38.02 |
37.82 |
6-Oct |
|
30-Sep |
DXD |
35.07 |
34.89 |
6-Oct |
|
30-Sep |
DDM |
38.16 |
37.95 |
30-Sep |
|
30-Sep |
DXD |
34.87 |
34.67 |
30-Sep |
|
28-Sep |
DDM |
38.16 |
37.96 |
30-Sep |
|
24-Sep |
DXD |
35.08 |
34.9 |
28-Sep |
|
16-Sep |
DDM |
38.23 |
38.03 |
24-Sep |
|
15-Sep |
DXD |
35.26 |
35.08 |
16-Sep |
Updated 10.6.09:
The
Market has increased aggressively recently, it has
moved back above longer term resistance again, and
we needed to take action. We experienced a few
stops, and ended the day in DDM.
|
6-Oct |
DDM |
38.03 |
|
|
|
6-Oct |
DXD |
35.05 |
34.87 |
6-Oct |
|
6-Oct |
DDM |
38.02 |
37.82 |
6-Oct |
|
30-Sep |
DXD |
35.07 |
34.89 |
6-Oct |
|
30-Sep |
DDM |
38.16 |
37.95 |
30-Sep |
|
30-Sep |
DXD |
34.87 |
34.67 |
30-Sep |
|
28-Sep |
DDM |
38.16 |
37.96 |
30-Sep |
|
24-Sep |
DXD |
35.08 |
34.9 |
28-Sep |
|
16-Sep |
DDM |
38.23 |
38.03 |
24-Sep |
|
15-Sep |
DXD |
35.26 |
35.08 |
16-Sep |
Updated 10.1.09:
The
Market has begun to decline. Our 10% profit
stop threshold is 38.57. If DXD increases to
this level, set a profit stop at 38.49 and let the
position ride. If the position stops, revert
to the existing parameters and our defined rule.
However, if the Market continues to fall instead,
and if the Market tests 9040 and we are still
holding DXD, sell DXD at that level instead, and
then revert to the rules. A test is 25 market
points as usual.
Updated 9.30.09:
The
strategic plan had a busy day today. 3 stops
occurred.
We
should be long DXD.
|
30-Sep |
DXD |
35.07 |
|
|
|
30-Sep |
DDM |
38.16 |
37.95 |
30-Sep |
|
30-Sep |
DXD |
34.87 |
34.67 |
30-Sep |
|
28-Sep |
DDM |
38.16 |
37.96 |
30-Sep |
|
24-Sep |
DXD |
35.08 |
34.9 |
28-Sep |
|
16-Sep |
DDM |
38.23 |
38.03 |
24-Sep |
|
15-Sep |
DXD |
35.26 |
35.08 |
16-Sep |
Updated 9.28.09
DXD
stopped and we reverted back to DDM
|
28-Sep |
DDM |
38.16 |
|
|
|
24-Sep |
DXD |
35.08 |
34.9 |
28-Sep |
|
16-Sep |
DDM |
38.23 |
38.03 |
24-Sep |
|
15-Sep |
DXD |
35.26 |
35.08 |
16-Sep |
Updated 9.24.09:
DDM
stopped and we converted to DXD.
|
24-Sep |
DXD |
35.08 |
|
|
|
|
|
16-Sep |
DDM |
38.23 |
38.03 |
24-Sep |
|
|
|
15-Sep |
DXD |
35.26 |
35.08 |
16-Sep |
|
|
Updated 9.16.09:
DXD
stopped, and we converted to DDM. We should be
holding DDM according to rule. We should have
a 0.5% stop loss in place.
|
16-Sep |
DDM |
38.23 |
|
|
|
|
|
15-Sep |
DXD |
35.26 |
35.08 |
16-Sep |
|
|
Updated 9.15.09:
The
next phase of the Strategic Plan began when 9728 as
tested in the Dow. According to plan, DXD was
triggered as a long position with a 0.5% stop loss
and conversion strategy incorporated to control risk
and transition with the Market if needed. This
is part of the underlying strategy. If we are
stopped, we should revert to the rules, and the
qualifications associated with them.
Estimated entry level = $35.26. Associated
stop would be $35.08
Updated 9.10.09:
Strategic Plan.
Warning: Do not trade
the Strategic Plan until you have watched one phase from start to finish.
This year:
-
Return: +38%
-
Days in cash: over
100
-
Number of trades: 45
-
Trades at major
inflections points exclusively.
-
Long/Short Strategy
-
Designed as a Proactive
Alternative to Buy and Hold
-
Trades long and short
-
Uses ETFs: DDM and DXD
-
Focuses on the Dow
This is an excellent
strategy, and it works very well. However, many people fail to use it
properly if they fail to understand how to use it first. Therefore, either
wait, watch, and paper trade along with the rest of us, or take Boot Camp and
learn how to do it before committing real money, or do both.
We are rapidly approaching
9728. This will trigger the next phase of the Strategic Plan. If you
are trading, or paper trading along with us, please follow the rules outlined on
the Strategic Plan page, under Strategies on the Beta Site. A trigger will become official if the Market comes within
25 points of 9728, and then our conversion rules will fall into place. If
you are using real money, you should know these rules already.
Updated 8.31.09:
We
secured a gain in the most recent phase of our
strategic plan today. We locked in 9.43%, but
our net was only about 2%. This was the
toughest phase of the Strategic Plan to date.
There were a series of stops before the Market
moved. Most of these happened in one day, when
the Market floundered endlessly. In any case,
the Strategic Plan is now +38% YTD, we are in cash,
and we are waiting for the next trigger.
|
YTD Return: |
Strategic |
Plan = |
38.03% |
|
|
|
|
|
|
|
|
|
|
|
|
Enter date |
ETF |
Enter price |
Exit price |
Exit Date |
Difference |
% return |
|
|
|
|
|
|
|
|
|
|
|
|
|
|
|
|
|
29-Jul |
DDM |
32.89 |
35.99 |
31-Aug |
3.1 |
9.43% |
|
29-Jul |
DXD |
41.48 |
41.26 |
29-Jul |
-0.22 |
-0.53% |
|
29-Jul |
DDM |
32.86 |
32.7 |
29-Jul |
-0.16 |
-0.49% |
|
29-Jul |
DXD |
41.49 |
41.28 |
29-Jul |
-0.21 |
-0.51% |
|
29-Jul |
DDM |
32.87 |
32.69 |
29-Jul |
-0.18 |
-0.55% |
|
29-Jul |
DXD |
41.49 |
41.28 |
29-Jul |
-0.21 |
-0.51% |
|
29-Jul |
DDM |
32.89 |
32.7 |
29-Jul |
-0.19 |
-0.58% |
|
29-Jul |
DXD |
41.51 |
41.28 |
29-Jul |
-0.23 |
-0.55% |
|
28-Jul |
DDM |
32.86 |
32.69 |
29-Jul |
-0.17 |
-0.52% |
|
28-Jul |
DXD |
41.5 |
41.29 |
28-Jul |
-0.21 |
-0.51% |
|
24-Jul |
DDM |
32.87 |
32.69 |
28-Jul |
-0.18 |
-0.55% |
|
24-Jul |
DXD |
41.5 |
41.28 |
24-Jul |
-0.22 |
-0.53% |
|
23-Jul |
DDM |
32.85 |
32.66 |
24-Jul |
-0.19 |
-0.58% |
|
23-Jul |
DXD |
41.55 |
41.34 |
23-Jul |
-0.21 |
-0.51% |
|
23-Jul |
DXD |
41.74 |
41.53 |
23-Jul |
-0.21 |
-0.50% |
Updated 8.21.09:
I have lowered the
upside parameter slightly. The new array is:
Dow parameters for
Strategic Plan: 7191 - 8052 - 9040 - 9728 - 10745
I changed 9749 to
9728. Otherwise the parameters are the same.
Given Friday's
move, we have now initiated a profit stop in the
Strategic Plan. If we are stopped, we will
secure gains of about 10%. However, there is
another possibility. We have not had this
happen before. Therefore, what I say here sets
precedence. We have always taken profits
before the Market moved from one parameter to
another, so we never had a case where we were
holding a position when a new parameter was tested.
Interestingly, that could happen in this phase of
the Strategic Plan.
If the Market tests
9728 and we are still in DDM from when the Market
was near 9040, we should sell DDM and revert back to
the rules. A test means that the Market is
within 25 points of 9728. Therefore, if the
Market is between 9703 and 9728, and we are still in
DDM, sell it, and if the Market is still within 25
points, buy DXD and revert back to the rules.
That would be about a 15% return from our entry,
offset by our stops of course.
8.21.09
We now have a
profit stop in DDM just under $36. If DDM gets
to $37.8 we will increase our profit stop to $37.6.
That is about 5%. This falls in line with the
5% trailing profit stop rule.
8.3.09
We are very close to setting a profit stop in the
Strategic Plan. We will start to consider this
when we are 10% in the Money. Our DDM entry
was 32.89. 10% equates to $36.17.
Therefore, if DDM equals $36.17 in the near future
set a stop loss at $35.99 and let the position ride.
If it stops, close the position and revert back to
the rules, and wait for a new trigger according to
the rules. However, if the Market and DDM move
higher after our profit stop is implemented, we will
adjust it up every 5%. Therefore, at $37.8 we
will adjust the profit stop higher, and continue to
do so every 5% until the profit stop hits or until
9642 is tested.
8.16.09
Our
Strategic Plan Parameters have changed. They
are now:
Dow parameters for
Strategic Plan: 7191 - 8052 - 9040 - 9749 - 10745
Those should be used to guide trading decisions from
here. Unless they are changed, and those
updates are listed, the data points above will act
as trigger points.
7.29.09:
|
YTD Return: |
Strategic |
Plan = |
35.99% |
|
|
|
|
|
|
|
|
|
|
|
|
Enter date |
ETF |
Enter price |
Exit price |
Exit Date |
Difference |
% return |
|
|
|
|
|
|
|
|
|
|
|
|
|
|
|
|
|
29-Jul |
DDM |
32.89 |
|
|
|
|
|
29-Jul |
DXD |
41.48 |
41.26 |
29-Jul |
-0.22 |
-0.53% |
|
29-Jul |
DDM |
32.86 |
32.7 |
29-Jul |
-0.16 |
-0.49% |
|
29-Jul |
DXD |
41.49 |
41.28 |
29-Jul |
-0.21 |
-0.51% |
|
29-Jul |
DDM |
32.87 |
32.69 |
29-Jul |
-0.18 |
-0.55% |
|
29-Jul |
DXD |
41.49 |
41.28 |
29-Jul |
-0.21 |
-0.51% |
|
29-Jul |
DDM |
32.89 |
32.7 |
29-Jul |
-0.19 |
-0.58% |
|
29-Jul |
DXD |
41.51 |
41.28 |
29-Jul |
-0.23 |
-0.55% |
|
28-Jul |
DDM |
32.86 |
32.69 |
29-Jul |
-0.17 |
-0.52% |
|
28-Jul |
DXD |
41.5 |
41.29 |
28-Jul |
-0.21 |
-0.51% |
|
24-Jul |
DDM |
32.87 |
32.69 |
28-Jul |
-0.18 |
-0.55% |
|
24-Jul |
DXD |
41.5 |
41.28 |
24-Jul |
-0.22 |
-0.53% |
|
23-Jul |
DDM |
32.85 |
32.66 |
24-Jul |
-0.19 |
-0.58% |
|
23-Jul |
DXD |
41.55 |
41.34 |
23-Jul |
-0.21 |
-0.51% |
|
23-Jul |
DXD |
41.74 |
41.53 |
23-Jul |
-0.21 |
-0.50% |
|
30-Mar |
DDM |
22.51 |
25.99 |
2-Apr |
3.48 |
15.46% |
7.28.09
|
Enter date |
ETF |
Enter price |
Exit price |
Exit Date |
Difference |
% return |
| |
|
|
|
|
|
|
| |
|
|
|
|
|
|
|
28-Jul |
DDM |
32.86 |
open |
|
|
|
|
28-Jul |
DXD |
41.5 |
41.29 |
28-Jul |
-0.21 |
-0.51% |
|
24-Jul |
DDM |
32.87 |
32.69 |
28-Jul |
-0.18 |
-0.55% |
|
24-Jul |
DXD |
41.5 |
41.28 |
24-Jul |
-0.22 |
-0.53% |
|
23-Jul |
DDM |
32.85 |
32.66 |
24-Jul |
-0.19 |
-0.58% |
|
23-Jul |
DXD |
41.55 |
41.34 |
23-Jul |
-0.21 |
-0.51% |
|
23-Jul |
DXD |
41.74 |
41.53 |
23-Jul |
-0.21 |
-0.50% |
7.26.09
Our current
Strategic Plan has been traded as follows thus far:
|
24-Jul |
DDM |
32.87 |
|
|
|
|
|
24-Jul |
DXD |
41.5 |
41.28 |
24-Jul |
-0.22 |
-0.53% |
|
23-Jul |
DDM |
32.85 |
32.66 |
24-Jul |
-0.19 |
-0.58% |
|
23-Jul |
DXD |
41.55 |
41.34 |
23-Jul |
-0.21 |
-0.51% |
|
23-Jul |
DXD |
41.74 |
41.53 |
23-Jul |
-0.21 |
-0.50% |
7.26.09
Our Strategic
plan Parameters have changed slightly. They are now:
8077 - 9039 -
9642 - 10823
7.23.09:
The Strategic
Plan is active. We are in a position. Here are
the trades we have made YTD:
|
YTD Return: |
Strategic |
Plan = |
35.99% |
|
|
|
| |
|
|
|
|
|
|
|
Enter date |
ETF |
Enter price |
Exit price |
Exit Date |
Difference |
% return |
| |
|
|
|
|
|
|
| |
|
|
|
|
|
|
|
23-Jul |
DDM |
32.85 |
|
|
|
|
|
23-Jul |
DXD |
41.55 |
41.34 |
23-Jul |
|
|
|
23-Jul |
DXD |
41.74 |
41.53 |
23-Jul |
|
|
|
30-Mar |
DDM |
22.51 |
25.99 |
2-Apr |
3.48 |
15.46% |
|
30-Mar |
DXD |
65.69 |
65.35 |
30-Mar |
-0.34 |
-0.52% |
|
30-Mar |
DDM |
22.5 |
22.38 |
30-Mar |
-0.12 |
-0.53% |
|
23-Mar |
DDM |
22.68 |
24.98 |
26-Mar |
2.3 |
10.14% |
|
23-Mar |
DXD |
67.59 |
67.23 |
23-Mar |
-0.36 |
-0.53% |
|
23-Mar |
DDM |
22.67 |
22.54 |
23-Mar |
-0.13 |
-0.57% |
|
20-Mar |
DXD |
67.63 |
67.16 |
23-Mar |
-0.47 |
-0.69% |
|
20-Mar |
DDM |
22.73 |
22.61 |
20-Mar |
-0.12 |
-0.53% |
|
20-Mar |
DXD |
67.56 |
67.2 |
20-Mar |
-0.36 |
-0.53% |
|
19-Mar |
DXD |
67.85 |
67.3 |
20-Mar |
-0.55 |
-0.81% |
|
19-Mar |
DDM |
22.68 |
22.52 |
19-Mar |
-0.16 |
-0.71% |
|
19-Mar |
DXD |
67.86 |
67.48 |
19-Mar |
-0.38 |
-0.56% |
|
18-Mar |
DDM |
22.66 |
22.54 |
19-Mar |
-0.12 |
-0.53% |
|
18-Mar |
DXD |
67.68 |
67.33 |
18-Mar |
-0.35 |
-0.52% |
|
18-Mar |
DDM |
22.79 |
22.67 |
18-Mar |
-0.12 |
-0.53% |
|
18-Mar |
DXD |
67.52 |
66.63 |
18-Mar |
-0.89 |
-1.32% |
|
20-Feb |
DXD |
70.6 |
77.65 |
27-Feb |
7.05 |
9.99% |
|
20-Feb |
DDM |
22.95 |
22.8 |
20-Feb |
-0.15 |
-0.65% |
|
20-Feb |
DXD |
70.78 |
70.39 |
20-Feb |
-0.39 |
-0.55% |
|
19-Feb |
DDM |
23.05 |
22.22 |
20-Feb |
-0.83 |
-3.60% |
|
6-Jan |
DXD |
50.38 |
60.44 |
14-Jan |
10.06 |
19.97% |
|
6-Jan |
DDM |
33.91 |
33.74 |
6-Jan |
-0.17 |
-0.50% |
|
6-Jan |
DXD |
50.4 |
50.1 |
6-Jan |
-0.3 |
-0.60% |
|
6-Jan |
DDM |
33.93 |
33.76 |
6-Jan |
-0.17 |
-0.50% |
|
6-Jan |
DXD |
50.44 |
50.16 |
6-Jan |
-0.28 |
-0.56% |
|
6-Jan |
DDM |
33.84 |
33.65 |
6-Jan |
-0.19 |
-0.56% |
|
5-Jan |
DXD |
50.55 |
50.23 |
6-Jan |
-0.32 |
-0.63% |
|
5-Jan |
DDM |
33.84 |
33.64 |
5-Jan |
-0.2 |
-0.59% |
|
5-Jan |
DXD |
50.55 |
50.24 |
5-Jan |
-0.31 |
-0.61% |
|
2-Jan |
DDM |
33.78 |
33.33 |
5-Jan |
-0.45 |
-1.33% |
7.23.09:
This is an
easy to understand visual explanation:
http://www.stocktradersdaily.com/clubsite/Club/Strategic%20Plan/strategicplan721092/strategicplan721092.htm
7.21.09
Parameters:
Dow parameters for Strategic Plan:
6525 - 7191 - 8052 - 9039 - 9716
The Dow
Jones industrial average is approaching longer-term
resistance. Recently, it came within 10 points of our
defined longer-term support level. Now, suddenly, a
test a longer-term resistance lines looks imminent.
Longer-term resistance as defined in our strategic plan is
9039 for the Dow Jones industrial average. The
instructions below explain exactly how we should trade the
strategic plan based on the expected test of 9039. Use
it to guide your trades.
Instructions:
-
As soon as the Market falls
between 9014 and 9039 buy DXD.
-
Do not wait, use market orders,
and do not second guess your decision.
-
Immediately set a 0.5% stop loss
based on your fill, not on market levels.
-
If you are stopped, see where
the Market is and use the rules.
-
If the Market is within 25
points of 9039 again, buy either DDM or DXD
-
DDM will be bought if the Market
is > 9039 and < 9064
-
DXD will be bought if the Market
is > 9014 and < 9039
-
If a stop and second buy occurs,
use a 0.5% stop again and repeat.
-
If another stop occurs, start at
rule #5 and work forward.
-
Continue to convert until the
Market makes up its mind on direction.
-
This may take a few days.
We may incur multiple stops.
-
Once the Market begins to move,
look to secure gains.
-
When your position is in the
money by 10% set a profit stop.
-
Additional guidelines will be
provided when that happens.
-
DO NOT use too much money.
DO NOT have expectations.
-
You must pay attention for a few
days.
-
After we secure gains we will
revert to cash again.
7.7.09:
With a test of
8052 coming, we should be ready to engage the next phase of
the Strategic Plan. Consider these both instructions
and warnings. First, do not think the Strategic Plan
is easy to follow. +36% YTD on 29 trades, and in cash
for over 90 days sounds great, but the Strategy is not easy
to follow unless you are disciplined. Stops will
occur, small losses will need to be realized, and the plan
should be followed precisely, otherwise it will not be
effective. If it is followed, the plan will work like
it has in the past.
Instructions:
-
As soon as
the Market falls between 8052 and 8077 buy DDM.
-
Do not wait,
use market orders, and do not second guess your
decision.
-
Immediately
set a 0.5% stop loss based on your fill, not on market
levels.
-
If you are
stopped, see where the Market is and use the rules.
-
If the
Market is within 25 points of 8052 again, buy either DDM
or DXD
-
DDM will be
bought if the Market is > 8052 and < 8077
-
DXD will be
bought if the Market is > 8027 and < 8052
-
If a stop
and second buy occurs, use a 0.5% stop again and repeat.
-
If another
stop occurs, start at rule #5 and work forward.
-
Continue to
convert until the Market makes up its mind on direction.
-
This may
take a few days. We may incur multiple stops.
-
Once the
Market begins to move, look to secure gains.
-
When your
position is in the money by 10% set a profit stop.
-
Additional
guidelines will be provided when that happens.
-
DO NOT use
too much money. DO NOT have expectations.
-
You must pay
attention for a few days.
-
After we
secure gains we will revert to cash again.
6.9.09
Our Economic
analysis has been updated, and it now extends beyond 2010
with this current report. It is titled: The Grimm
Reaper is Knocking. It uses the Investment Rate to
compare current demand ratios to normalized demand ratios to
gauge future economic activity. This was the same
basis used in the Return to Parity Analysis issued in
December, 2008. It also references the PST and TBT
positions that were recommended in December, and the UYG and
URE positions that were recommended the day after the Market
bottomed in March. This is a must read for everyone
because it sets the tone for the next six months.
The Grimm Reaper is Knocking
Updated 5.3.09
our combined
longer-term analysis has been updated and the signals
stemming from our revised analysis will act as the trigger
points for our strategic plan going forward. All
charts, The longer term charts of the Dow, the S&P 500, and
the NASDAQ are congruent. They show the same general
patterns and together they provide an outline for market
direction throughout 2009. This analysis should be
used in conjunction with my return to parity analysis.
This is important because it lays the groundwork for our
decisions going forward.
I have prepared
a presentation explains my outlook for the remainder of
2009. Please take the time to review this
presentation. It will only take a few minutes.
http://www.stocktradersdaily.com/2009Strategy/player.html
Strategic Plan:
Dow parameters for Strategic Plan:
6525 - 7191 - 8052 - 9039 - 9716
Updated 4.7.09:
our combined
longer-term analysis tells us that the market may decline
and the Dow Jones industrial average may re test converted
longer-term support levels. Watch 7441 closely.
Our strategic plan is currently in cash, but if 7441 is
tested we should engage the strategy again. Use the
following plan to guide the trades in the strategic plan if
7441 is tested again:
Dow parameters for Strategic Plan:
6385 - 7441 - 9054 - 10800
Strategic Plan:
-
If The Market comes within 25
points of 7441 buy DDM (7441 - 7466)
-
Set a 0.5% stop loss. This
will stop below 7441 if rule #1 is followed.
-
If a stop occurs convert to DXD
with the same 0.5% stop loss.
-
If another stop occurs convert back to
DDM.
-
Repeat this process as many
times as needed.
-
Expect a few stops, but the
losses are small.
-
After a few times, expect the
Market to follow through.
-
We do not know the direction it
will go.
-
When 10% in gains are realized
set a trailing profit stop.
-
Review the Strategic Plan link
for examples of past trades
Updated 4.2.09
Dow parameters for Strategic Plan:
6385 - 7441 - 9054 - 10800
Strategic Plan:
We locked in 15.46% today.
Great Job!
|
YTD Return: |
Strategic |
Plan = |
35.99% |
|
|
|
| |
|
|
|
|
|
|
|
Enter date |
ETF |
Enter price |
Exit price |
Exit Date |
Difference |
% return |
| |
|
|
|
|
|
|
|
30-Mar |
DDM |
22.51 |
25.99 |
2-Apr |
3.48 |
15.46% |
|
30-Mar |
DXD |
65.69 |
65.35 |
30-Mar |
-0.34 |
-0.52% |
|
30-Mar |
DDM |
22.5 |
22.38 |
30-Mar |
-0.12 |
-0.53% |
Updated 4.1.09
The Strategic
Plan is approaching our lock - in of 10%. We must now
incorporate the Profit Stop Rule.
Here is a plan to initiate profit stops in the strategic
plan:
-
If DDM gets to 25.1 set a stop at 24.99 and leave it
there. Do not trail. If it dips the profit stop
will trigger.
-
If DDM gets to 26.1 move the stop up to 25.99 and
leave it there
-
If DDM gets to 27.1, repeat.
-
Continue to do this until the profit stop hit
Longer term support in the Dow Jones
industrial average was tested again and new triggers occurred for the strategic
plan. Our combined longer-term analysis continues to tell us that higher
levels of lie ahead so long as 7441 remains in tact as support in the Dow.
Treat that as a key level of inflection. If this support level remains
intact all three markets are likely to trend higher quite aggressively over
time. This is an inflection level for longer term positions, and the test
that occurred on Monday began the next phase of our strategic plan.
Currently, we should have a long bias with an upside target of 9054. This
will hold unless 7441 breaks lower. The strategic plan is a well defined
risk controlled strategy using market-based ETFs. The trades that have
occurred as far, since Monday, are listed below. The details regarding the
strategy are found in the Strategic Plan page in the main menu of our website.
Dow parameters for Strategic Plan:
6385 - 7441 - 9054 - 10800
|
YTD Return: |
Strategic |
Plan = |
21.58% |
|
|
|
|
|
|
|
|
|
|
|
|
Enter date |
ETF |
Enter price |
Exit price |
Exit Date |
Difference |
% return |
|
|
|
|
|
|
|
|
|
30-Mar |
DDM |
22.51 |
open |
|
|
|
|
30-Mar |
DXD |
65.69 |
65.35 |
30-Mar |
-0.34 |
-0.52% |
|
30-Mar |
DDM |
22.5 |
22.38 |
30-Mar |
-0.12 |
-0.53% |
Updated 3.26.09
Our combined
longer term analysis tells us that the market has broken
above longer term resistance and is poised to accelerate
over time until it tests secondary resistance levels.
The resistance levels which were recently broken have now
been converted into support and they still are considered
inflection parameters. Our current analysis tells us
to expect the market to trend higher, but it may not trend
higher with out backing and filling along the way. In
fact, a retest of recently broken resistance, which is now
converted support, may even occur before an official test of
secondary resistance levels happen.
STRATEGIC PLAN:
The most recent
phase of our recent strategic plan was closed with a modest
gain. All strategic plan participants should now be in
cash. We will not trade again until such time as one
of our established parameters are tested. These are
subject to change, but the parameters are listed below.
For those persons following the strategic plan, we should
appreciate the cash position. The strategic plan is
currently up more than 21% YTD, and we have been in cash
most of the time. Best of all, we have been able to
make money regardless of market direction, and we have
always remained in control of our risk. This will not
change, and this is why we have performed well this year.
It is why we perform well every year. Do not become
overwhelmed with current market conditions. It does
not matter to you. The strategic plan is one of the
best ways of making money in any market environment, and all
it takes is a little focus. Do not cave to emotions
and risk! If 7440 is tested again in the Dow we will
re-engage the strategy. otherwise, we wait for 9054.
Dow parameters
for Strategic Plan: 6385 - 7440 - 9054 - 10800
|
YTD Return: |
Strategic |
Plan = |
21.58% |
|
|
|
| |
|
|
|
|
|
|
|
Enter date |
ETF |
Enter price |
Exit price |
Exit Date |
Difference |
% return |
| |
|
|
|
|
|
|
|
23-Mar |
DDM |
22.68 |
24.98 |
26-Mar |
2.3 |
10.14% |
|
23-Mar |
DXD |
67.59 |
67.23 |
23-Mar |
-0.36 |
-0.53% |
|
23-Mar |
DDM |
22.67 |
22.54 |
23-Mar |
-0.13 |
-0.57% |
|
20-Mar |
DXD |
67.63 |
67.16 |
23-Mar |
-0.47 |
-0.69% |
|
20-Mar |
DDM |
22.73 |
22.61 |
20-Mar |
-0.12 |
-0.53% |
|
20-Mar |
DXD |
67.56 |
67.2 |
20-Mar |
-0.36 |
-0.53% |
|
19-Mar |
DXD |
67.85 |
67.3 |
20-Mar |
-0.55 |
-0.81% |
|
19-Mar |
DDM |
22.68 |
22.52 |
19-Mar |
-0.16 |
-0.71% |
|
19-Mar |
DXD |
67.86 |
67.48 |
19-Mar |
-0.38 |
-0.56% |
|
18-Mar |
DDM |
22.66 |
22.54 |
19-Mar |
-0.12 |
-0.53% |
|
18-Mar |
DXD |
67.68 |
67.33 |
18-Mar |
-0.35 |
-0.52% |
|
18-Mar |
DDM |
22.79 |
22.67 |
18-Mar |
-0.12 |
-0.53% |
|
18-Mar |
DXD |
67.52 |
66.63 |
18-Mar |
-0.89 |
-1.32% |
Updated
3.23.09:
Our combined
longer term analysis shows us that there has broken out to
the upside. 7440 has been broken and the Market seems
to be accelerating higher. 9054 is our upside target
if 7440 remains in tact as converted longer term support.
In addition, the Market has moved enough to warrant a
discussion of profit stops in the strategic plan.
By rule, we want
to set a profit stop to secure 10% in gains.
reasonably, there have been a series of stops this time, so
I expect our profit margin to be smaller for this phase of
the strategic plan. In any case, we are holding about
8% in paper gains according to strategy. This is
offset largely by the stops.
A 10% profit
from our entry in DDM would be just under $25.
Specifically, $24.948. With that understood, this is
the rule I want to use for this profit stop: If DDM
gets to $25.1 or higher set a profit stop just under $25
($24.99) and let that position ride. Do not trial the
profit stop. Instead, if the position gets into the
money by another 5% we will move the profit stop up by that
margin at that time and continue to follow it in 5%
increments. We can use 1 point as a rule. So if
DDM gets to 26.1 set the stop just under 26. Then 27.1
under 27, etc.
|
YTD Return: |
Strategic |
Plan = |
19.26% |
|
|
|
| |
|
|
|
|
|
|
|
Enter date |
ETF |
Enter price |
Exit price |
Exit Date |
Difference |
% return |
| |
|
|
|
|
|
|
|
23-Mar |
DDM |
22.68 |
|
|
|
|
|
23-Mar |
DXD |
67.59 |
67.23 |
23-Mar |
-0.36 |
-0.53% |
|
23-Mar |
DDM |
22.67 |
22.54 |
23-Mar |
-0.13 |
-0.57% |
|
20-Mar |
DXD |
67.63 |
67.16 |
23-Mar |
-0.47 |
-0.69% |
|
20-Mar |
DDM |
22.73 |
22.61 |
20-Mar |
-0.12 |
-0.53% |
|
20-Mar |
DXD |
67.56 |
67.2 |
20-Mar |
-0.36 |
-0.53% |
|
19-Mar |
DXD |
67.85 |
67.3 |
20-Mar |
-0.55 |
-0.81% |
|
19-Mar |
DDM |
22.68 |
22.52 |
19-Mar |
-0.16 |
-0.71% |
|
19-Mar |
DXD |
67.86 |
67.48 |
19-Mar |
-0.38 |
-0.56% |
|
18-Mar |
DDM |
22.66 |
22.54 |
19-Mar |
-0.12 |
-0.53% |
|
18-Mar |
DXD |
67.68 |
67.33 |
18-Mar |
-0.35 |
-0.52% |
|
18-Mar |
DDM |
22.79 |
22.67 |
18-Mar |
-0.12 |
-0.53% |
|
18-Mar |
DXD |
67.52 |
66.63 |
18-Mar |
-0.89 |
-1.32% |
Updated 3.12.09
Our combined
longer term analysis shows us that longer term support
levels have held. Official tests occurred in the S&P
and NASDAQ, and the Dow came very close to an official test
as well. From here, a test of resistance is likely to
occur in the Dow as it moves higher. Support held, and
appropriately resistance is poised to be tested now.
Longer term converted resistance is 7440. Treat it as
the next level of longer term inflection and the catalyst
for the next leg of the strategic plan. By rule, a
test of resistance is a short signal, but if it breaks we
will convert to long too. Do not be one - sided.
-
If The Market comes within 25
points of 7440 buy DXD (7415 - 7440)
-
Set a 0.5% stop loss. This
will stop above 7440 if rule #1 is followed.
-
If a stop occurs convert to DDM
with the same 0.5% stop loss.
-
If a stop occurs convert back to
DXD.
-
Repeat this process as many
times as needed.
-
Expect a few stops, but the
losses are small.
-
After a few times, expect the
Market to follow through.
-
We do not know the direction it
will go.
-
When 10% in gains are realized
set a trailing profit stop.
-
Review the Strategic Plan link
for examples of past trades
Updated
3.12.09:
If this breakout is for real I am a
huge fan of both UYG and URE.
I think these can easily double or
triple over the next 3 months...
Mid term resistance needs to stay
broken. It is now converted support. If it stays broken I
expect the surge to hold too. Treat that as a stop loss if
you decide on UYG and URE. In other words, if mid term
converted support starts to break lower again go to cash
again with those and covert as needed from there (same as
strategic plan).
However, if it holds, these are going
to do extremely well in my opinion. This has direct ties
tot he return to parity analysis I have provided.
I am turning bullish and will stay that
way if this continues...
Updated 3.1.09
In my circle, it is almost eerily quiet. No one seems
anxious, even though the Market closed at 12-year lows. I
expected some resistance and apprehension at least.
Although I see none now, that could change.
Instead, I am hearing terms like ‘whatever’ or ‘I’m not even
looking at it.’ This is bad. Capitulatory cycles start
with controlled declines, like the ones we have seen
recently. Then a denial phase overcomes investors for a
while as they sit and hope for the best. Finally, when the
Market really starts to get ugly, they start to pay
attention again. When they do, they also start to panic.
We just went through this a few months ago. Is everyone
that shortsighted
With panic comes opportunity, and that is what we are
looking to capture.
Before I continue, my references here suggest capitulation
at some point soon. This can be thwarted, so I want to
address this possibility before I move forward with
discussion. If the Market turns higher and breaks above
7441 in the Dow, a bullish sign will come. This is our
actionable reversal signal for the Strategic Plan. We will
not sit in a bearish posture if the Market reverses. After
all, I expect 2009 to end on a strongly positive note.
However, the immediate move in the Market seems to be down.
If that continues, it is likely to get ugly at the same
time. Our combined longer-term analysis, evidenced in the
analysis – charts section of our beta site, tells us that a
decline to 6384 is likely to occur soon. That equates to an
additional 10% decline from current levels, and a net 27%
decline in the Dow YTD.
Using my Fibonacci Calculations, we also find a confirmation
at 6641. First, I will explain how I found this data, and
then I will conceptualize the developing strategy.
Recent highs in the Dow were 9054. Because I am referencing
longer-term strategies in this email, I am using the Dow to
manage strategy. If I were using the day or swing trading
strategies, I would use the NASDAQ of course. In any case,
by navigating to the beta site – strategies – Fibonacci
Calculator, I am able to find these natural regression
statistics. Using that calculator, I type 9054 in the High
Box and click calculate. The data on the left shows a
series of data derived from the Golden Sequence.
For those persons not familiar with this, the application
may be easier than the derivation. The calculator is
simple, and very easy to use. For now, keep it that way.
Importantly, our objective is to correlate the longer-term
support level in the Dow (6384) that was derived using
technical analysis, to one of the data points in the
Fibonacci Calculator derived using the natural sequence. If
you are following along using the Calculator in the Beta
Site, look at the T4 value on the left side. That value is
6681
For anyone familiar with this application, you already know
that we look for breaks of Fibonacci data, and then reversal
higher to confirm. Our multi-year applications of the
Strategic Plan have always used this strategy. However,
with 1000 point intraday swings, we had to modify it with
the volatile conditions in 2008. That is where the DDM –
DXD strategies came from. Review the Strategic Plan link in
the Beta Site for details.
Reasonably, we have two corresponding data points. 6681 –
6384. We always expect technically derived support data to
be lower than Fibonacci support levels, so this situation
fits perfectly. Our immediate strategy suggests that a
decline to 6384 should take place. That means a break below
6681 should happen too.
Assuming a test of technically derived support occurs, if
support holds, and if the Market turns higher from 6384, it
will also break back above 6681 too. If it happens
according to plan, 6681 will also be confirmation. This
will tell us that the Market is likely to move higher
aggressively afterwards.
Therefore, we have defined strategy:
-
Expect lower levels unless the Dow reverses above 7441
-
If the Dow tests 7441 again, engage the DDM – DXD
strategy.
-
Target 6385 if the declines continue, and consider it
support
-
Engage the DDM – DXD strategy around 6384 again
-
If the Market reverses higher from 6385, consider 6681
as a confirmation level suggesting higher levels. This
should increase confidence levels and could compel both
positions trades and institutional buy programs
accordingly.
5.
If the Market reverses higher from 6385, consider
6681 as a confirmation level suggesting higher levels. This
should increase confidence levels and could compel both
positions trades and institutional buy programs accordingly.
I will turn bullish again either if 6385 is tested, or if
the Dow breaks back above 7441. For our strategic plan
followers, we should be in cash with about 20% in gains for
the year. If the turmoil I foresee takes shape, cash may be
the best place for your longer term assets. The Strategic
Plan, after all, is a proactive strategy and an alternative
to longer-term buy and hold traditions.
Updated 2.27.09
According to
rule, we should have locked in 10% in gains from the
recent trades in the strategic plan. Review the table
below for details. We should now be in cash and
waiting for the next test of support or resistance.
The market was near 7100 when this was written, so it falls
between 8384 (support) and 7441 (resistance).
Here is the
current array:
6385 -
7441
- 9054 - 11776
|
YTD Return: |
Strategic |
Plan = |
19.26% |
|
|
|
| |
|
|
|
|
|
|
|
Enter date |
ETF |
Enter price |
Exit price |
Exit Date |
Difference |
% return |
|
20-Feb |
DXD |
70.6 |
77.65 |
27-Feb |
7.05 |
9.99% |
|
20-Feb |
DDM |
22.95 |
22.8 |
20-Feb |
-0.15 |
-0.65% |
|
20-Feb |
DXD |
70.78 |
70.39 |
20-Feb |
-0.39 |
-0.55% |
|
19-Feb |
DDM |
23.05 |
22.22 |
20-Feb |
-0.83 |
-3.60% |
|
6-Jan |
DXD |
50.38 |
60.44 |
14-Jan |
10.06 |
19.97% |
|
6-Jan |
DDM |
33.91 |
33.74 |
6-Jan |
-0.17 |
-0.50% |
|
6-Jan |
DXD |
50.4 |
50.1 |
6-Jan |
-0.3 |
-0.60% |
|
6-Jan |
DDM |
33.93 |
33.76 |
6-Jan |
-0.17 |
-0.50% |
|
6-Jan |
DXD |
50.44 |
50.16 |
6-Jan |
-0.28 |
-0.56% |
|
6-Jan |
DDM |
33.84 |
33.65 |
6-Jan |
-0.19 |
-0.56% |
|
5-Jan |
DXD |
50.55 |
50.23 |
6-Jan |
-0.32 |
-0.63% |
|
5-Jan |
DDM |
33.84 |
33.64 |
5-Jan |
-0.2 |
-0.59% |
|
5-Jan |
DXD |
50.55 |
50.24 |
5-Jan |
-0.31 |
-0.61% |
|
2-Jan |
DDM |
33.78 |
33.33 |
5-Jan |
-0.45 |
-1.33% |
Updated 2.22.09
We experienced
a greater than anticipated stop on Friday. Afterwards
we should have converted to DXD. Initially, we were
well in the money until political banter changed the
dynamics, and we were stopped once in DXD and had to
converted and revert. This second trade was much more
frustrating to me than the initial stop. In any case,
according to plan, we should be holding a loss from the
recent trades, and DXD according tot he summary table below.
The are approximate entry and exit levels:
|
YTD Return: |
Strategic |
Plan = |
9.28% |
|
|
|
| |
|
|
|
|
|
|
|
Enter date |
ETF |
Enter price |
Exit price |
Exit Date |
Difference |
% return |
|
20-Feb |
DXD |
70.6 |
|
|
|
|
|
20-Feb |
DDM |
22.95 |
22.8 |
20-Feb |
-0.15 |
-0.65% |
|
20-Feb |
DXD |
70.78 |
70.39 |
20-Feb |
-0.39 |
-0.55% |
|
19-Feb |
DDM |
23.05 |
22.22 |
20-Feb |
-0.83 |
-3.60% |
|
6-Jan |
DXD |
50.38 |
60.44 |
14-Jan |
10.06 |
19.97% |
|
6-Jan |
DDM |
33.91 |
33.74 |
6-Jan |
-0.17 |
-0.50% |
|
6-Jan |
DXD |
50.4 |
50.1 |
6-Jan |
-0.3 |
-0.60% |
|
6-Jan |
DDM |
33.93 |
33.76 |
6-Jan |
-0.17 |
-0.50% |
|
6-Jan |
DXD |
50.44 |
50.16 |
6-Jan |
-0.28 |
-0.56% |
|
6-Jan |
DDM |
33.84 |
33.65 |
6-Jan |
-0.19 |
-0.56% |
|
5-Jan |
DXD |
50.55 |
50.23 |
6-Jan |
-0.32 |
-0.63% |
|
5-Jan |
DDM |
33.84 |
33.64 |
5-Jan |
-0.2 |
-0.59% |
|
5-Jan |
DXD |
50.55 |
50.24 |
5-Jan |
-0.31 |
-0.61% |
|
2-Jan |
DDM |
33.78 |
33.33 |
5-Jan |
-0.45 |
-1.33% |
Updated 2.17.09
Our combined longer term analysis tells us that the Market
is within striking distance of 7441 in the Dow. A test
of 7441 would be a buy signal. However, conversion
strategies are recommended, and we should be willing to turn
short if support breaks too. Our stop losses are
tight, entry levels are restricted, and re-entry levels are
defined. These can all be found in the Strategic Plan
page as well, but they are also listed below. First,
here are the parameters:
7441
- 9054 - 11776
Here is the Strategy:
-
If the Market is between 7441 and 7466 buy DDM and set a
0.5% stop.
-
If DDM is stopped buy DXD only if the Market is between
7416 and 7441 and set a 0.5% stop.
-
The 0.5% stop equates to a little more than 25 Dow
Points.
-
Be willing to repeat this trade as many times as needed.
IE, stop DXD and buy DDM again if the Market reverses
again too, and start over.
-
If the Market opens below 7441 start with DXD instead,
so long as the conditions above are satisfied, and
follow the same steps.
-
Expect this strategy to stop a few times.
-
This will be a busy strategy for 1-2 days most likely.
-
10% profit stops will be advised if the position gets in
the money.
-
After we close the position expect to be in cash for a
while.
-
The table below is an excellent example of this strategy
and it should help manage expectations.
Updated 2.3.09
We should have added four
stocks to the position trades. For anyone who does not
want to follow the disciplined strategy outlined above,
these positions trades were recommended on 2.3.09.
They are not meant to replace the strategic plan.
However, they satisfy the desire of some people to position
trade.
These entry prices were the
median price of each stock this day:
-
MSFT: 18.10
-
GE: 11.60
-
URE: 4.26
-
UYG: 3.19
In addition, we should be
holding PST from December
Updated 1.19.09
I have updated the parameters
for our strategic plan. From this point forward, and
unless adjusted beforehand, we should use the following
array to guide our decisions in the strategic plan:
7441
- 9054 - 11776
7440 is the first level of
support, and 9054 is the first level of resistance. We
should currently be in cash, and we should be positioned to
buy QID or QLD according to the rules associated with out
strategic plan. We may be in cash for a while, but we
are also holding nice gains for the year. Cash should
be appreciated. We do not need to trade all the time
to take advantage of these excellent opportunities. I
expect another trading signal to surface within the next
couple weeks. Until then, sit tight.
Here is the chart pattern
which produces these data points:
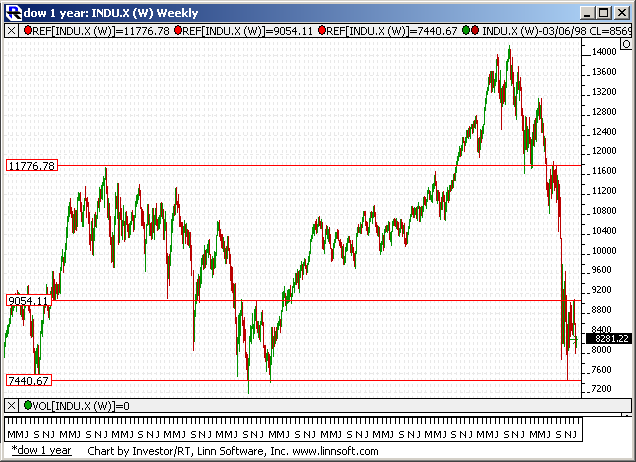
Updated 1.14.09
It is
official.
We should
have locked in about 20% in gains from the strategic plan,
and we should now be in cash. From here, a new trigger will
occur either when 7400 is tested or if 9029 is tested again
instead. If you are following the strategic plan, until
that time we remain in cash
Also, please
do the following. You deserve it.
-
Stand up immediately.
-
Put
your hands in the air over your head.
-
Then
rip then down to your waist
-
Yell: CHA CHING while you do it
-
Repeat this process three times in a row.
-
Don't worry about your coworkers
-
Then
go buy yourself a nice lunch.
-
You
deserve it
Also, don't
forget to give someone else some of your positive energy
too. Many people out there would appreciate a smile if you
have one to give.
|
YTD Return: |
Strategic |
Plan = |
14.08% |
|
|
|
|
|
|
|
|
|
|
|
|
Enter date |
ETF |
Enter price |
Exit price |
Exit Date |
Difference |
% return |
|
6-Jan |
DXD |
50.38 |
60.44 |
14-Jan |
10.06 |
19.97% |
|
6-Jan |
DDM |
33.91 |
33.74 |
6-Jan |
-0.17 |
-0.50% |
|
6-Jan |
DXD |
50.4 |
50.1 |
6-Jan |
-0.3 |
-0.60% |
|
6-Jan |
DDM |
33.93 |
33.76 |
6-Jan |
-0.17 |
-0.50% |
|
6-Jan |
DXD |
50.44 |
50.16 |
6-Jan |
-0.28 |
-0.56% |
|
6-Jan |
DDM |
33.84 |
33.65 |
6-Jan |
-0.19 |
-0.56% |
|
5-Jan |
DXD |
50.55 |
50.23 |
6-Jan |
-0.32 |
-0.63% |
|
5-Jan |
DDM |
33.84 |
33.64 |
5-Jan |
-0.2 |
-0.59% |
|
5-Jan |
DXD |
50.55 |
50.24 |
5-Jan |
-0.31 |
-0.61% |
|
2-Jan |
DDM |
33.78 |
33.33 |
5-Jan |
-0.45 |
-1.33% |
Updated 1.13.09
We should currently have a
10% profit stop in place, but we should increase that if our
gains increase beyond 20%. Please recognize the
following guide: if the Market continues to decline, and our
gains increase beyond 20%, set a profit stop at 20% and let
that position ride. In essence, we would increase the
profit stop by 10% using this process.
The exact DXD level, according to our strategic plan entry
table, would be $60.44. If DXD increases beyond $60.44 we
should increase our current profit stop from $55.41 to
$60.44 accordingly.
From here, one of two things is going to happen: Either we
are going to get stopped out with about a 10% gain, or we
are going to stair step our profit stop higher if the Market
declines some more. In any case, this is a relatively good
place to be for the time being.
Clearly, the road was a little bumpy at first, but that’s
part of the process. It starts busy, and then slows down
fast. So far this has been decent, but the trade is not
complete, and the fat lady has not sung. Only after the
trade is closed will we be allowed to evaluate the
conditions we set for this phase of the strategic plan.
until then, we sit tight.
|
YTD Return: |
Strategic |
Plan = |
-5.88% |
|
|
|
| |
|
|
|
|
|
|
|
Enter date |
ETF |
Enter price |
Exit price |
Exit Date |
Difference |
% return |
|
6-Jan |
DXD |
50.38 |
open |
|
#VALUE! |
#VALUE! |
|
6-Jan |
DDM |
33.91 |
33.74 |
6-Jan |
-0.17 |
-0.50% |
|
6-Jan |
DXD |
50.4 |
50.1 |
6-Jan |
-0.3 |
-0.60% |
|
6-Jan |
DDM |
33.93 |
33.76 |
6-Jan |
-0.17 |
-0.50% |
|
6-Jan |
DXD |
50.44 |
50.16 |
6-Jan |
-0.28 |
-0.56% |
|
6-Jan |
DDM |
33.84 |
33.65 |
6-Jan |
-0.19 |
-0.56% |
|
5-Jan |
DXD |
50.55 |
50.23 |
6-Jan |
-0.32 |
-0.63% |
|
5-Jan |
DDM |
33.84 |
33.64 |
5-Jan |
-0.2 |
-0.59% |
|
5-Jan |
DXD |
50.55 |
50.24 |
5-Jan |
-0.31 |
-0.61% |
|
2-Jan |
DDM |
33.78 |
33.33 |
5-Jan |
-0.45 |
-1.33% |
Updated 1.5.09
On Monday there were a series of
trades in the Strategic Plan. We should be holding a slight loss as a
result.
|
YTD Return: |
Strategic |
Plan = |
-2.54% |
|
|
|
| |
|
|
|
|
|
|
|
Enter date |
ETF |
Enter price |
Exit price |
Exit Date |
Difference |
% return |
|
5-Jan |
DXD |
50.55 |
open |
|
#VALUE! |
#VALUE! |
|
5-Jan |
DDM |
33.84 |
33.64 |
5-Jan |
-0.2 |
-0.59% |
|
5-Jan |
DXD |
50.55 |
50.24 |
5-Jan |
-0.31 |
-0.61% |
|
2-Jan |
DDM |
33.78 |
33.33 |
5-Jan |
-0.45 |
-1.33% |
Dow inflection parameters:
7400 - 9029 - 9707 - 10800
Updated 1.3.09:
We should have converted from short to long.
The Dow has broken above 9029, our predefined inflection
point. Because this resistance level has broken higher
we should have converted from DXD to DDM in the strategic
plan, and we should now be net long the Market. If
this strategy was followed precisely, we probably had a
slight gain from this strategy. Although DXD was
stopped, we also had a distribution that sold 25% of the
position at much lower market levels. that translated
into higher share prices for this double weighted short ETF.
In essence, that surprise distribution may have turned out
to be a good thing because we locked in gains early.
In any case, we should now be long DDM, and we should expect
the Market to move higher so long as 9029 remains in tact as
converted support. Our upside target for the Dow is
currently 9707. Here is a rundown of our current
parameters, and the guidelines that we will use for the
strategic plan going forward.
Dow inflection parameters:
7400 - 9029 - 9707 - 10800
Therefore, if 9029 holds as converted support we should
expect 9707. However, if 9029 breaks lower again we
should expect 7400 instead. That means 9029 is a
conversion parameter accordingly. I have already
outlined this process, and the simple re-entry guidelines in
the December 9th summary below. Please review them for
risk assessment and strategy details.
Officially, a conversion has taken place, and unless the
Market reverses back below 9029 we are in a bullish
position. So long as the entry levels for these
positions was within 25 points of 9029, continued to use a
0.05% stop loss and reversal trigger as well.
Updated 12.12.08
We should be short
from 9029.
The current
direction of our strategic plan is to short the market when the Dow Jones
industrial average test 9029. We do this using market-based ETFs. In
fact, this recommendation has already been established. When the market
tested 9029 on December 8th we initiated a position in DXD This is the
double weighted short Dow ETF. Some of us have already chosen to take
profits when 10% was achievable, and that's great. For those who did scalp
the position a reentry is okay if the market comes within 25 points of 9029
again. When the official test occurred in early December the market came
within four points of this resistance level and then turned down. Not only
does that prove that this is an important resistance level, but it tells us to
repeat the process again if resistance is tested.
However, we cannot
be one-sided. In addition, we cannot establish a position like this and
forgo protectionists stop losses. My recommendation stands. We
should use one half of 1% stop loss for any position established within 25
points of 9029. Then, we should be willing to convert from short to long
if the market breaks above resistance. For example, if the market tests
9029 we should buy DXD and set a one half of 1% stop loss in the position.
Then, if the market breaks above 9029 we should not only stop out of that double
weighted short position, but we should also enter the double weighted long.
The symbol for this is DDM. The same one half of 1% stop loss ratio should
be included for that trade too. From there, a conversion technique will
take over. If the market reverses the lower again we will need to stop out
of the long position too and reenter the short. This transition will
happen over and over again as needed until such time as the Market makes up its
mind on direction.
Understandably,
some of us may not want to convert back and forth. Some of us may instead
want to trade in one direction only. For those that choose this route I
continue to recommend the long side. For those people who want to trade
one direction only and who recognize time constraints which would prevent them
from using conversion techniques, simply engage a reentry strategy instead.
The re-entry strategy works as follows If the market breaks above 9029 and
is within 25 points of 9029 then establish a long opposition in DDM. From
there set a one half of 1% stop loss and direct that trade to repeat
automatically if it is stopped. You should be able to do this at Fidelity
and a few other brokerage firms out there. Soon we will also offer an
automated system which will do this for you. In any case, that trade may
be stopped once or twice, but eventually the market will make up its mind on
direction. If the market moves higher, which is capable of doing, this
trade should not only protect your investment but also allow you to ride the
wave higher too. This can be executed manually, or automatically of
course.
Updated 12.7.08:
This is an update to our strategic plan. This
update was made on December 7, 2008. Our current
position should be 100% cash. This entry
supersedes all other entries. Please disregard any
recommendations that were made prior to this. We
have two important inflection points which are acting as
chaos like boundaries to our trading decisions within
this strategic plan. The first, our support level,
is 7400. The second, our resistance level, is
9029. Evidenced by recent market action, we need
to prepare for a test of 9029 just in case. Prior
analysis suggested short positions if resistance was
tested. The same will hold true here, but we will
restrict the trading position to one market-based ETF
instead. We will use a conversion strategy which
will allow us to take advantage of either a reversal
lower from 9029, or a great above it too. If 9029
is tested, buy DXD with a tight associated stoploss.
I consider a test to the official when the market comes
within 25 points out our inflection parameter.
Accordingly, if the market tests 9029 and DXD is
triggered set a one half percent (0.5%) stop loss in the
position to project your assets. If that position
is stopped convert immediately to DDM, the long
side of the market, and implement the conversion
strategy with the same associated percentage stoploss.
Convert back and forth until such time as the Market
makes up its mind on direction.
Alternatively, for those unable or un-interested in
using the conversion technique, a reentry strategy can
be used instead. This time, however, I would not
begin the strategy unless 9029 breaks higher. I
have already explained my mid term bullish nature, I
have already demonstrated the return to parity that I
expect to prevail in the next six to 12 months.
With that, I believe the market will increase
accordingly and eventually. Therefore, I would
rather limit this reentry strategy to the longside.
Otherwise, if a reentry strategy is focused on the short
side instead, and if the market indeed breaks out and
accelerates higher in line with my return to parity
analysis, the upside potential that I foresee eventually
may be lost. Therefore, for those investors who
choose not to engage the conversion strategy mentioned
in the paragraph above, engage a reentry strategy
exclusive to DDM instead. If the market breaks
above 9029, buy DDM and use a one half percent (0.5%)
stop loss to protect the position. Set your trade to
reenter automatically if it is stopped, if you can.
This should allow you to take advantage of the upside
that I foresee if indeed the market breaks out.
Do not misconstrue this recommendation for a suggestion
that a breakout will indeed occur imminently. It
may not. If the market instead begins to turn
lower again we will need to address 7400 accordingly.
My prior recommendations associated with 7400 will then
take precedence. Please review the strategic plan
in detail and focus on the last few entries. The
entry associated with 7400 offers a strategy that is
divided into two parts. If instead of moving
higher towards 9029 the market moves lower to 7400
again, that two-part strategy should be used instead.
Updated 11:30.08
The Market came very close to
7400, which was our buy signal in the last installation of
the strategic plan. However, it did not test
officially, and a re-test seems probable. With that,
the following intermediate recommendation has been made:
Consider this an official recommendation in relation to the
strategic plan:
Allocation: 30% of the portfolio
Cash: 70% of the portfolio
Risk Controls: This is NOT a position trade. There are
strict risk controls associated with this recommendation and
they need to be adhered to. Failure to do so could result
in substantial losses. Also, an equal dollar amount in
each position is recommended to balance risk.
Recommendation: If the Dow tests 9075 buy the following
three ETFs with an equal weighting and strict risk
controls.
Stops: In each position set a stop and re-entry as a
condition trade. A 0.5% stop is fine.
The process: Wait for the Market to get near 9075. I
consider between 9050 - 9075 to be near, conditionally.
When the Market gets in that range allocate an equal dollar
amount to SRS, SKF, and DUG. For each, set a stop loss at
0.5% immediately, and set the trade up to repeat if it is
stopped. You may have to manually repeat this trade if your
broker does not allow repeat trades.
For example, if you enter DUG near $29 because it happens to
be near $29 when the Market tests 9075, set a stop at 28.85
and if DUG stops do NOT re-enter it unless it moves back
above $29 again. This would require a repeat of that
conditional trade. If DUG keeps falling instead, do not
chase it
Updated 11.20.08
The apparent imminent test of 7400 in the Dow Jones
industrial average will be a trading signal for our
strategic plan and we need to be prepared. When
7400 is tested a buy signal will present itself.
This time, I have separated the trades for this
phase of the strategic plan into two parts.
The first part is a pre-diversified position trading
strategy using sector specific ETFs. This should be
considered extremely aggressive because we will not
incorporate risk controls into this phase of the 2-part
strategy. I recommend limiting the exposure to 10 or 15% of
the portfolio as a result. For some, this position trading
strategy will not be of interest, for others the associated
risk of a position trade will dispel the integration, but
for those who engage in this position trade on the heels of
a test of 7400, I believe you will be handsomely rewarded in
6 to 12 months. This could even happen sooner depending on
Market conditions and sentiment shifts. The specific
strategy is to buy an equal dollar amount of the following
three ETFs when the Market is within at least 25 points of
7400:
· URE – Real
Estate
· UYG –
Financials
· DIG – Oil
The second part of this strategy involves the use of DDM or
DXD. I will not comingle NASDAQ Pro shares with Dow Pro
shares this time. If 7400 is tested, buy DDM with the
expectation of higher market levels over the course of the
next one to three months. If, however, 7400 breaks lower
two things should happen. First, for all investors, if 7400
breaks even slightly lower a stop should trigger and DDM
should be liquidated immediately. The objective here is to
protect risk because substantial declines are likely if 7400
breaks too.
However, this also requires the stop to be marginal in
nature. Therefore, the initial trade must also correlate
with an official test of 7400. Most of the time, I equate
that to within 25 points. So, when the market is at 7425,
begin to consider taking initial action.
As indicated above, an associated stop will not likely
result in a meaningful loss if the entry point is close to
7400, but it could given a divergence from this plan. If
you engage in the initial position further away than the 25
points I have recommended, the potential for accelerated
losses increase. My objective in recommending a trade
exclusive to near 7400 is both to realize the reward from
the potential reversal, but also to manage risk in a
controlled manner. From there, if you are stopped, you
should also be prepared to re-enter if 7400 breaks higher
again, and then repeat the risk control and re-entry process
if needed, manually, as many times as required and until the
Market determines direction. 7400 has been carefully
analyzed as an important level of support, and therefore as
a key level of longer term inflection.
A break will not only cause a stop in all portfolios, but
it will also trigger a conversion to the short ETF, DXD in
more nimble portfolios. If 7400 breaks lower, for those
nimble enough to take action, convert from DDM to DXD and
prepare to make money on the downside if the market begins
to crash even further. Expect to scalp with a 10% gain from
that double weighted proshare if the Market continues down.
10% is a good scalp ratio for this purpose, but it should
only be used on the downside. Hold DDM for much more on the
upside. This conversion technique will also require a
reversion back to DDM if the market reverses back above the
7400 again after breaking down, and continued repetition
back and forth is required as many times as necessary.
Therefore, 7400 in this instance requires attention and only
more nimble traders should engage this conversion technique.
However, an alternative exists for those persons not capable
of giving that much attention to this strategy. This in an
automatic re-entry alternative.
A slight difference exists in that this alternative will not
act as a conversion technique, but rather as a technique
that will allow you to automatically re-trigger your trade
if it is stopped, and then the Market reverses higher
again. For example, if the Market tests 7400 (under 7425)
and DDM is triggered, you can reasonably expect the position
to be stopped with a 0.5% loss if the market breaks below
7400. Do the math after the initial trade is executed,
determine your stoploss using 0.5%, and set your stoploss in
your trading platform so it triggers automatically. If you
enter DDM when the Dow is greater than 25 points from 7400
you will need to adjust this ratio. Then, set your program
up to repeat that trade again automatically at the same
entry point. The relationship between DDM and the level of
the Dow should make the re-entry level correspond to above
7400 as well, so the mechanical operation should control
your risk, and allow automatic re-entry until or unless the
Market begins to move higher. Most brokers will allow you
to set repeat trades like this.
Unfortunately, using this alternative will prevent you from
taking advantage of the conversion to the downside, but the
re-entry will allow you to participate on the upside, and
the stop will protect your risk. I cannot help you
negotiate your trading platform to set it up for this
particular type of trade. However, tomorrow morning a call
to your broker would be advisable. Pick up the phone, ask
them if they allow repeat trades like the one described
above, and learn how to set them up immediately. Then,
watch the Market, wait for a test of 7400, and start the
process with your initial trade and your initial stop loss.
You probably will not be able to set your system up to buy
at 7400, so expect to monitor the Market for a test to
initiate the process. The first phase of this process must
be done by you.
In any case, if the Market tests 7400 and then reverses
higher and back above 7625, I will become extremely
bullish. Although I don’t expect it, a break below 7400
would be extremely serious. For now, 7400 is intriguing
enough for me to offer a suggestion of position trades for a
selected portion of our portfolios. Those position trades
should be limited to 15% because they will not include
stops. Although I expect them to work, we must maintain
comprehensive risk control on the majority of our assets.
The other 85% of our portfolios which have been earmarked
for the strategic plan should refocus on DDM, and the
conversion technique or auto-repeat technique offered above.
These include risk controls appropriately.
Updated 11.16.08
We should be in
cash and waiting for a test of 7400 or 9775.
Our new parameters are: 7400, 9775,
10800.
Updated 11.12.08
We should be in
cash and waiting for a test of 7400.
I have removed 8825 from the inflection data
in the strategic plan. The last cycle pushed that
effort over the top, and although we had 10 - 20% scalping
opportunities regularly, position trading was difficult.
From here, extended gains can be realized with a slight
modification of our parameters. Our stratgic plan
positions should be relatively flat over the past week,
after the recent 10% gain in DXD and the slight losses
beforehand. From here the objective is to wait for a
test of one of the revised parameters before we take
additional action. Current momentum is down, and
therefore 7400 seems to be next in line. If indeed a
test occurs we should be buyers. This time I will not
recommend a concession between Dow and NASDAQ ETFs though.
Instead, just stick to the Dow. Let's stop being cute.
This will be cut and dry. If 7400 is tested, buy DDM.
If 7400 breaks convert to DXD and reengage the conversion
policy back to DDM again if 7400 breaks higher afterwards
too. Be willing to repeat this process as many times
as needed until direction is established. If 7400
breaks lower...well...let's just say watch out below.
Our effort at recalculating support is
intended to identify an easy to manage longer term position
trade opportunity. Something that we do not need to
repeat too often, like we have had to recently with 8825.
Our new parameters are: 7400, 9200,
10800.
Updated 11.11.08
We should be
holding DXD from near $77
In my November 10 update
I notified everyone that a global change would take place to our established
trading parameters as they relate to the strategic plan. 8825, though an
excellent pivot point for scalping, was an ineffective reversal trigger for
position trading. Scalping opportunities of 10-20% have been readily
available time and time again, based on the 8825 inflection, but position
trading has been difficult. Based on market fluctuations, our strategic
plan is probably down by approximately 6% in recent days, and that is
unacceptable. Our objective from this point will be to scalp our current
position, revert to cash, and wait for one of our new parameters to be tested.
Our new parameters still are based on the Dow Jones industrial average.
They are: 7400, 9200, and 10,800.
Our current
conversion parameter, the one from which we established our position in DXD, was
8825. We cannot relinquish that parameter until we have a gain of 8 to
10%. We are currently holding gains of 2.5%. This does not mean that
we need to sit on our hands while we wait for the price of the DXD to increase.
In fact, exactly the opposite. Instead, we need to use our conversion
rules as they relate to 8825, just in case another break higher occurs.
If it does, we should convert to QLD just like we have been doing in the recent
past and ride the upside instead. So long as we continue to convert,
eventually we will get an 8 to 10% increase in either the long or short position
and when we do we will exit this phase of the strategy and wait until one of our
new reversal triggers are tested. This move should take us back to
relative parity and position us to take advantage of the new stated reversal
triggers.
Updated 10.31.08
We should be long QLD from
near $31. Please review the 10.22.08 update below.
We are also 'borderline' aggressively bullish.
Updated 10.30.08
Because The Investment
Rate measures normalized demand we can rationalize ebbs and
flows in demand which are driven by non centralized
variables. Recently dissolved external variables fostered,
for example, the ‘cheap money’ conditions of recent past,
and increased demand ratios beyond their norm. When the
current level of demand exceeds normalized demand we can
rationally assume that overall demand for investments in our
economy will wane at some point, and come back into parity
with The Investment Rate. An unusual increase in demand is
indeed what took place in recent years, and the predictable
parity oscillation lower, to The Investment Rate, has
already come full circle.
On the other side of the
coin, if a void in demand is present we can rationally
assume that demand will eventually improve until such time
as it comes into parity with the Investment Rate as well.
Coincidentally this is the unique condition that faces our
economy today.
In simple terms, the
correction to parity has been overshot.
The Investment Rate
tells us that demand levels wane gradually until about 2010,
and then the declines get serious. Yes, 2007 was defined as
a peak in demand, but the major declines don’t start
immediately.

The incentivized cheap
money conditions have created a void in demand today, and
therefore an anomaly in The Investment Rate.
Reasonably, investment
demand that would otherwise have been slated for 2008 or
2009 was incentivized by cheap money to find a ‘home’ in
2005, or 2006, for example. Now, much of the demand that
would have otherwise existed in today’s Market is absent.
This void is causing
serious immediate concerns, but it is not likely to last
long.
Eventually the current
level of demand which is ‘void’ will return to parity with
The Investment Rate. Translated, in the next year or so
demand will appear robust compared to today’s levels.
Quarterly comparisons by Market Analysts are likely to draw
conclusions of future prosperity as well.
Not so fast!
The reversal to parity
might seem compelling at first glance, and that is likely to
be opportunistic from this point in time given the current
levels of the Market, but the amount of new money available
for investment into our economy declines for the next 16
years, so follow through is unlikely. A return to parity is
not a return to prosperity. Therefore, don’t be fooled by
the headfake that lies ahead, but expect one to come.
Updated 10.22.08
our combined longer-term analysis tells
us that the market has broken below neutral support.
This has occurred in all markets. Our strategic plan is
used as a trading tool referencing our longer-term
analysis and therefore this discussion of our combined
longer-term analysis focuses on trading strategies and
the strategic plan. We focus on one market when
referencing longer-term trades and that market is the
Dow Jones industrial average. Typically, all markets
move in relative tandem. That means, specifically, the
Dow, the NASDAQ, and the S&P 500 trend in line with each
other almost always. With that understood, our
strategic plan referencing the Dow Jones industrial
average can be applied and should be applied to all
markets. The focal point of our strategic plan was
recently support at 8825 and the Dow. On Wednesday 8825
broke lower and our strategic plan suggested that we
sell everything, 100% of longer-term assets be
liquidated, and short positions be taken. For those
persons following the strategic plan, that meant selling
QLD when 8825 broke lower, and immediately buying DXD in
expectation of lower levels. These two instruments
represent our suggested long and short plays
respectively. You should have bought DXD under $84 and
you should be holding with a downside target of 7595 in
the Dow. If that is tested you will sell DXD and buy
QLD, and repeat the same process again. This plan is
extremely simple and straightforward. However, it
requires you to be nimble. If you are trying to follow
these trades with a mutual fund instead of an ETF, think
again. Mutual funds are NOT the right tools for this.
We require you to be nimble. Don't use stocks either,
unless you like the uncertainty surrounding them.
Instead, use these simple, correlated ETFs in reference
to our market timing signals. They are, after all,
already positioned to move twice as fast as the Market.
Stay nimble and focus. For now direction is seems down
and 7595 is our downside target.
Updated 10.13.08
Continue to focus on the Dow for Longer Term
analysis. All markets have similar patterns. Our
combined longer term analysis tells us that the Market has
reversed above 8825 and it suggests that the Market is now
on its way to 10800 again. This assumes that 8825
holds as converted support. Trades in the Strategic
Plan are coming fast in this volatile Market, but so are
profits. We should have been short from 10,000 - 8825
and then long from 8825 -holding. We have locked in
about 11.75% x 2 (proshares are 2 x market levels) = 23.5%
thus far since last Monday. We should also be sitting
on gains of 6.4% x 2 = 12.8% from the longs when 8825 broke
higher. The fat lady has hardly sung though. Do
not get excited, simply continue to react. Check your
emotions at the door. Our combined longer term
analysis tells us to expect higher levels, but only if 8825
holds. If it breaks lower again the Market will
collapse instead. respect the position, but more
importantly respect the placement of these parameters.
By trading at defined support and resistance levels we
usually are able to avoid excessive whipsawing. The
decline below 10,000 last week was a great example, and now
8825 was another great example. Also, stick to your
plan. our longer term analysis tells us that the plan
should target 10800 for now. This is subject to
change, but changes will only take place via the nightly
newsletters so continue to monitor those regularly.
Updated 10.12.08
I have now extended the longer term charts to
20 years. I have some good news and some bad news.
The good news is...the support levels represented in the
charts of the S&P and the Dow, and the secondary support
level of the NASDAQ, are the last levels of support
evidenced by these 20 year charts, so if support holds the
market should turn up aggressively. The bad news
is...THESE ARE THE LAST LEVELS OF SUPPORT!!!!!! For
example, if the Dow breaks below 7595 and fails to reverse
higher the declines would be unfathomable. These words
are not coming lightly. However, I do not want to
caution you without offering positive alternatives.
There are reversal triggers in place, and you need to
respect those. Pay attention to the Dow. There
are 2 important reversal triggers here: reversal based
resistance is 8825, and reversal based support is 7595.
If the Dow moves above 8825 short positions should be
covered and long positions should be implemented. This
reversal from short to long should also be met with a
reversal from long to short again if 8825 breaks lower
again. This is the definition of a reversal trigger,
it requires flexibility, and it should be repeated as many
times as needed. The Market based ETFs I hav already
pinpointed provide that flexibility with excellent
liquidity. I have references 2 long ETFs and 2 short
ETFs and I want you to focus on 1 long and 1 short
respectively. The shorts are: DXD (Dow) and QID
(NASDAQ). The longs are: DDM (Dow) and QLD (NASDAQ).
For shorts I would focus on DXD. For longs I would
focus on QLD. These are pre-diversified, so you don't
need to use anything else!!! So in this example we
should be long DXD near 8825 with 7595 used as the next
downside reversal trigger. However, if 8825 breaks
higher we should sell 100% of the DXD and use all the funds
to buy QLD with an upside reversal trigger of 10800.
The support based reversal trigger at 7595
acts in the exact same way. If the market breaks below
7595 treat it as a reversal trigger. Let me know if
you have questions by sending an email to
support@stocktradersdaily.com
Updated 10.5.08.
Longer term support has been
broken. below you will find our longer term analysis
and a graph representing the break and current support and
resistance levels. This is a bearish sign.
A line in the sand has been
drawn at 10,000. If that psychological level breaks a
test of 8825 is probable. A reversal back above 10,800
would be bullish.
Longer term analysis:
Substantial changes have been made to our
longer-term analysis. Given the recent break below our
longer-term support levels we were forced to extend the
longer-term charts by a handful of years. We did this
in order to identify support levels because former support
levels had been broken. Our longer-term charts now
span nine years. The recent break of longer-term
support was significant. Our longer-term chart
analysis now tells us that the market could decline
considerably even after the recent declines have taken
place. The patterns in our longer-term chart analysis
initially suggested that a reversal could occur.
Normally breaks and immediate reversals take place when
longer-term support levels are tested. This process
began, but that reversal didn't last for long. The
break of longer-term support which occurred on Thursday and
which was confirmed on Friday was extremely bearish.
This confirmed the temporary break that occurred the week
before. Unless the market manages to reverse above
converted longer-term resistance, which is defined by the
neutral resistance line in our longer term charts and which
was support prior to the break, substantial declines lie
ahead. The potential declines would take the market to
levels not seen since late 2002. Our longer-term
analysis turned bearish officially on Thursday and it was
confirmed on Friday after the late day decline. Unless
the market reverses back into the longer-term channel
immediately, unless it breaks above converted resistance
immediately, the declines that lie ahead will be
significant. Immediately spans the course of eight few
trading sessions so this does not need to happen on Monday,
but it does need to happen soon to thwart a potential
collapse. A picture speaks a thousand words, and our
longer-term charts explain exactly how serious these
declines could be. Make sure you review them closely.
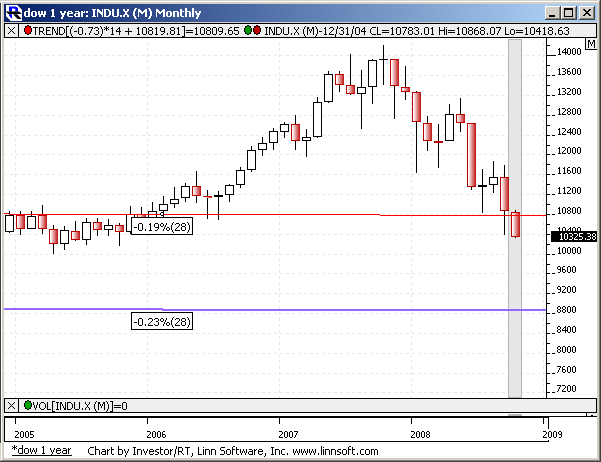
Updated 9.21.08
I have prepared a graphical
explanation of what took place in the strategic plan since
we began the long positions in the middle of July.
First, we hit the reversal trigger well in July, the Market
began to increase nicely, and we expected to see follow
through to our resistance targets. Given our
anticipated oscillation channels, we expected a longer term
down channel to develop, and we expected the forthcoming
test of resistance to be lower than the previous level of
resistance. This typically happens when down channels
develop, and we were expecting a down channel to solidify. A
series of lower highs and lower lows define down channels.
In this instance we expected the market to continue to
increase until such time as a lower high was established in
accordance with this developing down channel. Prior to
the recent debacle, a longer-term down channel was not
officially in place.
Then, prior to the Labor Day
holiday, volume dried up as most large institutional
managers went away on vacations, like they usually do just
before and right after the Labor Day holiday. Normally
this causes volatility, but the market rarely trends in one
direction. This time, with naked short selling
an integral factor, all hell broke loose. Mid tier
hedge funds took advantage of the low volume, lack of
leadership, underlying fears, and their ability to short
aggressively without borrowing stock (naked), and they beat
this market back when the leaders were away. They took
advantage of the fears on the street, to say it mildly.
Instead of increasing to
lower highs, the market instead declined to lower lows.
Nonetheless, the longer-term
down channel that we anticipated has still been established.
Instead of making a lower high though, the Market made a
surprise lower low. This was not how we expected it to
be established, but the down channel is now in place
nonetheless, and continued evaluation is necessary. At
this time the support level of this longer term down channel
has been solidified, a lower low has been established, and
now a lower high should be expected.
Interestingly, the
evaluations that we made in the early part of September and
the targets that we offered for resistance at that time are
still valid.
Please read the chart below
and realize that the out of sequence declines that took
place in September were rationally due to naked short
selling that began when institutional managers were away,
when volume dried up, and when mid tier hedge funds took
advantage of naked short selling opportunities and the fears
imposed on the market during the Labor Day holiday season.
We currently find ourselves
under water, but the upside potential still looks good until
resistance is tested. This tells us that we should
expect to recover any current losses that might be held on
paper, and then some.
QLD is still favored.
Find more details by reviewing the analysis that we provided
in the beginning of September (link below). In
summary, our upside target is 12,500 for the Dow. This
is the same as it was in that review.
Review the chart below first,
and then the link.
Upside target analysis
from 9.4.08:
http://www.stocktradersdaily.com/clubsite/Club/Strategic%20Plan/september08/player.html
Graphical illustration of
the recent debacle:
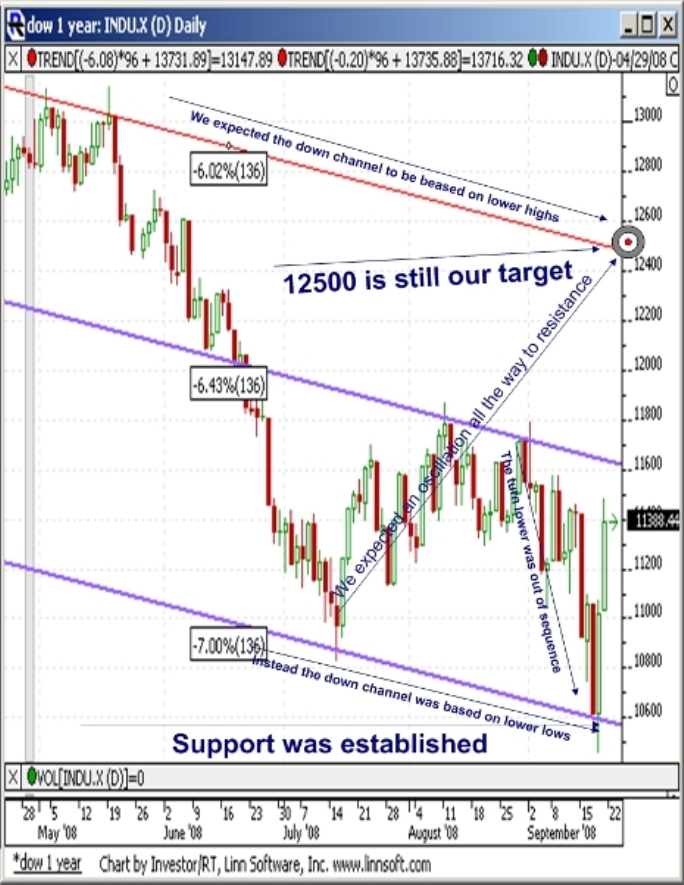
Updated 9.16.08
Finally, we
have seen everything that we need to see to call a near-term
bottom. The next question is, will it hold? My first guess
is, yes.
With that,
you have my blessing to step in and buy top tier names like
JPM, HPQ, MCD and other similar companies in expectations of
higher levels. I also think CAT, COF, and KLAC look
interesting. In addition, i will soon call a bottom in Oil,
but not quite yet. We are likely to see some more fallout
from Pension funds and other unwinding of positions as firms
transition back into stocks during this next up cycle.
The S&P 500
has successfully tested longer-term down channel support
lines. Officially, longer-term down channels are now in
place and from here we should expect a series of lower highs
and lower lows until such time as this trend breaks.
Mentally prepare for 2430 in the NASDAQ. That’s roughly a
10% recovery from current levels. This gives us some
insight to QLD in the strategic plan. This is a rough
estimate and it is not official
First,
here's some other corroborating evidence, the VIX has
reached capitulatory levels and major firms are being thrown
out with the bathwater. Bailouts, bankruptcies, and
financial turbulence that we could never otherwise imagine
has taken the market down to recent lows, and probably to a
near term bottoms. These support the test of longer term
support in the S&P.
But the AIG
bailout has calmed the street. And this might be the
ultimate turn of events that was needed to call a bottom.
From here I
expect the market to head up aggressively. Expect
aggressive short covering and expect a surge from the market
so long as there are no additional news events to thwart the
beginning of this next Bear market Rally.
We should
be long QLD from $62 after some back and forth efforts.
This is based on our strategic plan. I expect QLD to
oscillate higher along with the Market. However, I do not
expect QLD to get back to the highs seen during the last
rally. We may only see $76 from QLD this time. Everything
considered, that is acceptable. This is not set in stone,
but for now that is my upside target.
Updated 9.10.08
Everyone
needs to understand my downside risk analysis and we need to
have a game plan going into the next phase of the strategic
plan.
One of two
scenarios is going to play out: Either the market will hold
2200, or it won’t.
First, we
are net short from the break below 2240. We reverted from
net long to net short because of the Market weakness and to
protect our positions from a potential Market collapse.
Now, we should be long QID from near $48. This took place
on Tuesday and a second entry opportunity occurred on
Wednesday. This position may be held, or transferred
depending on the following scenarios…
If 2200
indeed holds as neutral longer-term support in the NASDAQ
then the market will reverse higher and test 2450 again
overtime, most likely.
If this
scenario pans out we have a reversal trigger in place which
tells us to switch from QID to QLD. The reversal signal
tells us to revert from QID to QLD if QID breaks below $48,
which was our entry and which should seamlessly transfer to
net long. Until, or unless that happens we should remain in
QID until a sell signal presents itself.
If the
Market continues to decline and 2200 breaks lower a longer
term down channel will form and a revised support level will
need to be observed. This will act as our downside risk
assessment. If 2200 breaks lower I expect a test of 2125.
I also expect the decline to be swift. That means another
100 points down from current levels, or approximately 4.5%.
That translates into a 9% gain in QID from current levels if
the Market declines as expected, and a 9% decline in QLD
accordingly.
If 2200
breaks, the downside risk in QLD will be 9%. That puts QLD
in the mid – upper 50s. At the same time that puts QID near
$55.
Our
objective, if 2200 breaks lower, will be to ride the wave
down to 2125, then revert to QLD for the reversal higher.
2400 may be a reasonable target from there, so we should get
back to current levels in QLD and then some in my opinion.
Gameplan:
Hold QID
and expect near $55, unless a reversal signal presents
itself.
Updated 9.10.08
I understand than some people did not convert to QID as
indicated in Friday's email and therefore they have ongoing
concerns about QLD. I nipped the bud early by recommending
a conversion to QID upon a break of 2240 and setting
reversal requirements. This was intended to be a proactive
move based on breakdowns that were taking place. Thus far
we should have QID from near $48 and we have new reversal
restrictions in place.
However, for those still in QLD, you may have work to do
soon.
If you are in QLD seriously consider switching to QID if
support breaks lower. Pick your poison, but 2200 is more
obvious to Wall Street and therefore will be more
significant.
If 2200 holds, you have nothing to do. If 2200 breaks you
need to protect yourself and convert to QID with reversal
requirements similar to the ones we have in place for QID
from 2240.
This Market continues to look weak and downside momentum
could increase immensely if 2200 breaks lower.
That's the major catalyst
Updated 9.9.08
Strategic Plan comments.
First, I know it doesn't feel good when gains turn into
losses. With that, we need to focus on forward looking
strategy.
We entered QLD in the low 70s and we held nice gains. Now
the stock is threatening to break longer term support along
with the NASDAQ. If this longer term support level breaks
aggressive declines are likely to follow. Respect $62 as
longer term support. If it holds the stock should fluctuate
back to $80. However, if $62 breaks lower a decline to $37
is likely instead. Risk control is obviously required
around $62.
We took steps to control our risk early by converting QLD to
QID upon the break below 2240 in the NASDAQ. We should now
have QID with a full position. However if the Market
reverses back over 2250 we have instructions to revert back
to QLD. I am going to modify those instructions and the
associated risk controls.
The charts below shows both QID and QLD analysis.
As QID moved above $48 a buy signal appeared. This
corresponded with 2240 NASDAQ. Sell signals also appeared
in QLD. We should be in QID from near $48 accordingly.
However, the TXN and FDX news after hours make that a
nervous position reasonably.
Therefore, we will use $48 for the risk control in QID and
become much more diligent. If QID moves below $48 convert
to QLD once more, but this time don't move back to QID
unless QLD breaks below $62. In other words, if we indeed
revert back to QLD on Wednesday do NOT plan on reversing
back again unless longer term neutral support is broken.
The Market is flirting with longer term support levels. If
it holds a reversal higher should occur again. We are
positioned for a break lower right now with the QID
position, but that will need to change if support holds.
Watch 2200 in the NASDAQ. If it breaks a dip below 2000 is
likely at some point.
So....
Hold QID if it stays over $48.
If QID reverses below $48 buy QLD and use $62 as a
conversion level.
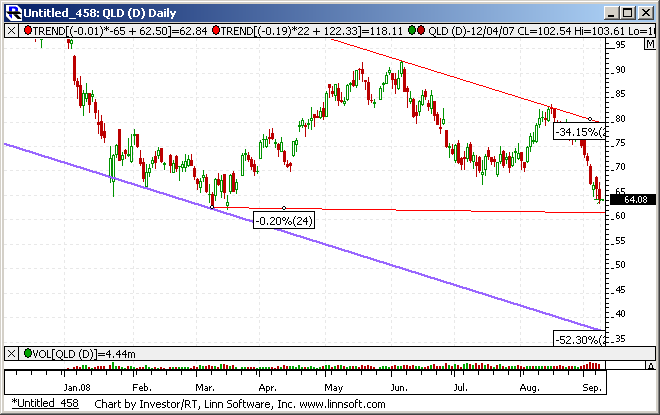
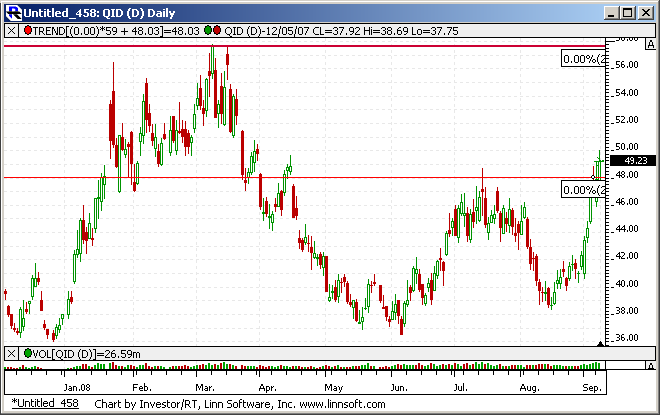
Updated 9.4.08
Risk controls are required for the strategic plan.
I developed the strategic plan so that we would not have to
actively trade these assets. We use a 3-position strategy
so that we can average into positions. This strategy
prevents us from needing to use stops, and other risk
controls, and it makes trading relatively easy. Until now,
that's been true. However, this time it might not be that
easy. In this case, we are already fully invested so there
will not be any averaging from here. We started the last
strategic plan cycle, the up-cycle, near current levels and
we already assumed all 3 positions. We are now back to
these levels and the risk appears higher than it was
before.
Thursday's decline was aggressive.
I am somewhat hesitant due to the lack of current leadership
that I suspect. However, that all changes on Monday anyway,
and if the leaders want to take this Market down more, they
could destroy it next week. Give or take, we need to
respect the indicators....
My words should not be taken lightly. I expect a very
severe decline at some point, I just don't expect it now.
Regardless, my expectations cannot sway the technical
indicators, and they tell us that risk controls are
required.
Given the aggressive nature of Thursday's action risk
controls are required sooner than later too. Therefore,
although 2200 is clearly longer term support in the NASDAQ,
evidenced in our charts, we won't wait for that to break in
order to protect our position.
My recommendation requires you to pay attention and it
requires you to be ready to make adjustments for at least
the next few trading sessions, so don't be passive here.
There will also be a spread risk in this recommendation, so
we could be stopped out and re-triggered a few times. The
Market reversal back to near recent lows requires you to be
attentive. Pay attention to inflection...
The inflection level that I want you to pay attention to is
2240. We will use this to signal that a transition is
needed.
The risk controls:
-
If the Market holds 2240, do absolutely nothing. Just
keep holding QLD and expect the Market to move higher.
-
However, if the Market breaks below 2240 I want you to
begin a protectionist cycle as follows:
If 2240 breaks lower I want you to sell all QLD and convert
100% to QID. There will be no 3-position strategy here.
Instead 100% of what was in QLD moves into QID. That leaves
us with another risk-scenario. If the Market then reverses
higher again we need to protect ourselves too, because QID
is net short. Therefore, we will use 2250 as our upside
protection if we convert to QID under 2240, and create a 10
point spread between 2240-2250. In other words, IF we
convert to QID because the market breaks below 2240, we
should be willing to convert back to QLD again if the Market
reverses back above 2250. From there 2240 becomes our risk
control pivot again and the process converts again with 2240
as the risk control. This process should be repeated as
many times as necessary.
The purpose of this strategy is to transition with the
Market from here if indeed the Market breaks down, but to
participate if it moves higher instead too.
We started the strategy near these levels, and I know that
we have left a good gain on the table, but let's not look
backwards.
Being proactive is critical.
-
If 2240 breaks lower convert to QID and if the market
continues down we will be positioned for it.
-
If then 2250 breaks higher though convert back to QLD
and use 2240 as the downside risk parameter again.
-
Repeat the process as needed and accept the 10 point
spread as risk control.
If you are NOT in QLD and 2240 holds, consider buying it
using this same risk protection recommendation. On that
same note, if 2240 breaks lower consider QID according to
the same.
Updated 9.4.08:
Tech has relinquished
leadership to Dow components and investors in tech seem
worried. We find value in QLD again as a result.
QLD looks excellent from near $70 based on a combination of
factors. The most important factor is our upside
market target. Summarized, we expect NASDAQ 2545.
We issued our detailed upside
Market target through this combined strategic plan analysis:
http://www.stocktradersdaily.com/clubsite/Club/Strategic%20Plan/september08/player.html
We expect to sell - short
again when resistance is tested.
Unless there are major
technical indicators which suggest otherwise, we should be
net long the Market at this time. Once resistance is
tested that will change.
Good Trading.
THK.
Updated 8.8.08:
The market continues to
react to declines in Oil prices, and it will almost surely
continue to do that until such time as OIL seems to be a
non-issue again. This will only happen when Oil dips below
a level perceived by the market as 'economically neutral.'
That level, in my opinion, is $100
My downside target for
Oil has been and continues to be slightly below $100.
The buy I recommended in
DUG, and the Outright shorts that I suggested for Oil itself
both had that target, as did prior USO recommendations.
Review my commentary on
the Money Show if you are interested in verbage specific to
XLE, DUG, USO, and Oil:
http://www.moneyshow.com/video/video.asp?wid=2229&t=3
With that understood, I
expect the Market to continue to react positively as Oil
prices decline. Once Oil dips below $100 I expect the
Market and Oil prices to diverge from their inverse
relationship again, at least for a short while as well.
In fact, given the
corresponding increases in the market that I expect in
relation tot he decline in Oil prices, I also expect greed
to come into the market again at that time and I expect that
tailwind to propel the market into overbought conditions.
This will be another
prime shorting opportunity in my opinion. The down-leg that
comes into the Market next time will be extremely painful
and Buy and Hold investors will have their heads handed to
them. Proactive trading strategies are the only way to make
money in today's market environment.
I expect the decline in
oil, the increase in the market, and the divergence
referenced above to come to fruition by late August - Mid
September. Short opportunities should present themselves at
that time too
Good Trading.
Sincerely,
Thomas H. Kee Jr.
President and CEO,
Stock Traders Daily.
Updated 7.20.08
The Market seems to have
bottomed according to our combined analysis. Please
refer to the presentation that we provided to you 2 weeks
ago:
http://www.stocktradersdaily.com/clubsite/Club/Strategic
Plan/julylow/player.html
Officially, we should be ALL
IN. In other words, we should be long the Market with
our investable assets and we should expect an acceleration
to resistance levels over the next 1-3 months. We have
not identified resistance yet, but we expect resistance to
be lower this time versus the last established resistance
level. A longer term down channel is developing
according to our combined analysis and that means a series
of lower lows and lower highs lie ahead. The next down
leg should be much more aggressive.
For now the oscillation from
support to resistance seems to have begun.
Individual stocks are much
more risky than Market based instruments. If you are
interested in more aggressive returns, consider QLD as a
double weighted Market Based ETF for the NADSDAQ.
Updated 6.23.08
Watch for a reversal trigger this week. I am
specifically watching the Dow Jones industrial average and
11,800. I expect a break below 11800 and then a reversal
higher. The reversal above 11,800 will be a buy signal for
longer-term accounts.
If you are holding cash in your 401(k) or
your IRAs, or if you have longer-term assets that are being
held short or in cash, 11,800 should be used as a cover and
a buy signal.
The process is as follows: first wait for a
break below 11,800. This could reasonably take place on
Monday. Once this happens wait for the market to reverse
back above 11,800 and then put your money to work.
If your longer-term assets are being held in
an IRA, or in another account that is not a 401(k), the best
bet may be to use market-based ETFs as opposed to mutual
funds or stocks. The reasons vary, but with market-based
ETF you can enter those immediately whereas mutual funds
limit the entry point to the end of day values of those
funds.
Conservative investors who are using this
reversal trigger to enter new long positions should consider
a market based ETF that is a single weighted. This means if
the market moves up 1% the single weighted ETF will move up
by 1% as well. Consider DDM for this position.
More aggressive investors should consider a
double weighted market based ETF instead. A double weighted
market based ETF will move twice as much as the market. For
example, if the market moves up by 1% a double weighted ETF
will move up by 2%. QID. should be considered for this
position
I am expecting this reversal trigger to take
place in the next couple of days.
In addition to this reversal trigger I want
to offer some commentary on the last move lower. This move
began before sell signals took place within our model. The
market began to move down immediately as oil prices began to
surge. This correlation, or better said inverse correlation
between oil prices and the level of the market created an
abnormal decline within a longer-term oscillation channel.
Hindsight is obviously 2020, but we are back
near our original entry levels. We lightened up on 20% of
our holdings near the top, and we should reenter the market
with a that position when this reversal trigger occurs.
This is the strategy for people currently engaged in our
strategic plan.
For those of you just getting started with
the strategic plan the buy signals that exist upon the
reversal trigger when the market breaks below and then
reverses back above 11,800 should be considered for
investments that span one to three months
The next time resistance levels are tested we
expected the declines that follow to be much more aggressive
than the declines witnessed here.
The increases we expect after this reversal
trigger signals, therefore, will only be temporary.
However, the opportunity to make money on the up side should
be taken. So long as your mindset continues to be proactive
and so long as you enter these positions with the intention
of selling them when resistance levels are tested
officially, engaging in long positions on the heels of this
reversal trigger is supported.
Updated 6.7.08
We continue to believe that
the market will trade within a sideways pattern until the
4th quarter, and then aggressive declines will take hold.
The aggressive decline in the
Dow and NASDAQ on Friday is concerning. Driven largely
by Oil speculation and Fear, the declines should not be
dismissed. High Oil Prices are a concern, and although
Oil prices are at lofty current levels solely based on
speculation and new entrants to the commodity, high energy
prices will hurt the economy and corporate earnings over
time. We know this and we need to accept this as fact.
This does not change our
strategic plan though. Remember, our strategic plan
spans the course of months, and during those months we must
accept volatility. Sometimes, even, we'll see gains
turn into loses while the volatility of the Market swings
our investment choices back and forth.
If you are not comfortable
with these volatility levels, or if you feel like you could
be making more money if you were more proactive, then stop
following the strategic plan strategy now. This is
designed for patient investors who can wait for a few months
in order to let the Market Transition to our stated
inflection levels.
If you want to be more
proactive, our swing trading strategy or stock of the week
should be followed instead, or maybe even one of the day
trading options. These will be much more proactive to
market based oscillation cycles than span much shorter
durations, and they may make you much more comfortable int
he face of the recent volatility.
Review them by clicking on
the Trading Tab above.
Updated 5.21.08:
Many of you are concerned with the level of the Dow. The
downside indicator that I issued for the Dow in the
strategic plan has changed slightly because the Dow is
weaker than the associated markets. The Strategic Plan is a
combined analysis, although we tend to focus on the Dow.
Currently the S&P and the NASDAQ have not offered the same
bearish signals, but that doesn't mean that they won't. I
am watching 1380 in the S&P closely because a break of this
support level would indeed offer bearish signals too and
corroborate the Dow. In essence, the broader Markets are
more resilient than the Dow, and therefore I am allowing
sway while I wait to see if the S&P breaks too. I am not
blind to the downside risk though, and I have no problem
turning 180 degrees and becoming aggressive on the short
side if needed. However, most of you know that I was
willing to buy the last dip, and because this in essence is
the second dip, I am still willing to buy it. Therefore,
the NYX and DDM option were called based ont he test of
support that is likely to occur in the S&P very soon
(1380). If you are following the Strategic Plan you need to
stay on your toes because major events could take place.
There could be major adjustments if 1380 breaks in the S&P.
Watch your email closely.
Buy the following with the upside target of 13460 in the
Dow:
1. NYX
(Long) Resistance Plan:
Buy over 65.87, target 70.58 (or higher), Stop Loss @ 65.61 -
reversal trigger
If 65.87 begins to break higher, the technical summary data
tells us to buy NYX just over 65.87, with an upside target
of 70.58. The data also tells us to set a stop loss @ 65.61
in case the stock turns against the trade. 65.87 is the
first level of resistance above 65.54 , and by rule, any
break above resistance is a buy signal. In this case, 65.87,
initial resistance, would be breaking higher, so a buy
signal would exist. Because this plan is based on a break of
resistance, it is referred to as a Long Resistance Plan.
2. DDMJX.X -
This is a Oct '08 76 call option on DDM. Your should be
able to get it near $6.7 Only use a small % of the strategic
plan portfolio. No more than 5%. This should be the same
$$$ that was used to buy BSC at $3.
Updated 4.30.08:
The Market tested 13000
perfectly and it has begun to retreat slightly. 13000
could turn out to be the resistance level we are looking,
but we will need confirmation of this resistance level
before we act. Our upside target, for now, continues
to be 13460 from our 3.27.08 update, but we will not look
resistance in the face.
Instead, we have identified
confirmation at 12660. If this level breaks lower we
will consider it a signal that the Market will continue to
decline from longer term resistance and test longer term
support levels again. A 1000 point slide is reasonable
if 12660 breaks lower. This will, in essence, confirm
13000 as longer term resistance.
A break below 12660 is not
what we are expecting, but instead it is a confirmation
signal that will tell us that our current target of 13460
may not be tested.
Right now our upside target
of 13460 remains in place. We expect the market to
increase beyond 13000 soon, without breaching 12660.
If that happens a surge towards 13460 could come quickly.
If 12660 breaks though we
will sell all long positions and adopt a short bias.
The information below is an
update from 3.27.08:
We are expecting the Market
to trend higher from current levels and test 13460 or so.
Here is an overview of my expectations for 2008 including my
upside target for the current up-cycle in our Strategic
Plan:
-
I expect the Market to trade sideways until, about,
October.
-
In the 4th Quarter of 2008 I expect the Market to
experience serious declines.
-
In fact, signs of serious weakness may begin to
surface in September.
-
Until then the Market will be in a wide trading
channel.
-
Support seems to have been identified near 11700,
Dow.
-
We will leave our 11996 reversal trigger in place to
mark support for now
-
Adjustments will be made if needed during the next
down cycle.
-
We are currently in an up-cycle; the market is
trending higher from support - resistance
-
Our job now is to identify resistance.
Resistance Identified:
I have incorporated tools from the Investment Rate,
Technical Analysis, and Fibonacci Calculations to determine
the next resistance level in our ongoing Strategic Trading
Plan. Without including unrealized returns from the last
test of support through current levels, the Strategic Plan
is up about 39% based on Market levels alone since inception
in August of last year. Keep in mind that past results are
no guarantee of future results.
I am measuring resistance in the Dow but that should be
construed to include other US Equity Markets; over time the
Markets trend in the same direction. IE when the Dow tests
resistance I expect the NASDAQ and S&P to do the same at
about the same time.
There is an important resistance level in the Dow that needs
to break higher in order for my upside target to be tested;
12795 must break higher or the Dow will fall back to 11700
or so again quickly. I am expecting a test of 11795 at
least during this upward cycle in the Strategic Plan, but
more so I also expect that resistance level to break higher.
My upside target for the Dow is near 13460.
I have not included this in our graphic because we may need
to adjust it to 12795. However, I think the bottoming
process of this most recent test of support is well grounded
and therefore I think 12795 will break higher this time.
The Market seems to have bottomed because:
-
Retail contrarian sentiment indicators derived from
our internal analysis suggests that retail investors
are scared out of the market. The reports which we
sell through Reuters, and other integral partners of
the same caliber, usually have a 70% - 30% retail -
institutional mix. In March retail sales dropped
from 70% to 2 %. Retail traders stopped buying,
they usually do this at bottoms.
-
Our reversal trigger has been confirmed
-
BSC was executed, and that supports a reversal.
-
Technical Analysis tells us we are trending higher
from support
Takeaways:
-
Expect the market to trend higher and test 12795 at
least
-
Expect the Market to stall there
-
I expect the Market to break higher
-
If it does expect 13460.
-
If it doesn't expect a reversal to 11700 or so.
-
Either way we are looking for a wide trading channel
to develop until the 4th quarter.
-
During the 4th quarter I expect another wave of
aggressive Market declines according to the
Investment Rate.
Current Upside Target:
Dow: 13460
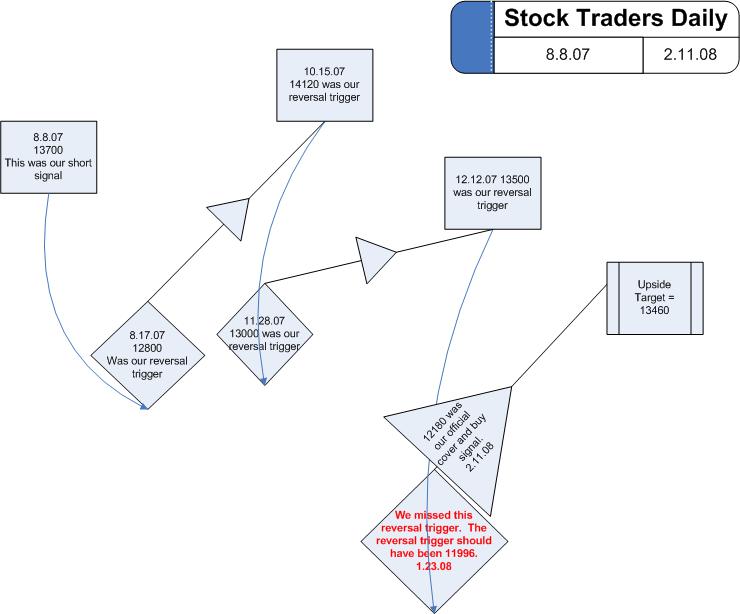
Disclaimer: You can lose money by investing in stocks.
Past performance also does not guarantee future results. Do
not attempt to invest in any trading strategy without first
consulting with your trusted investment advisors. The type
of trades made in this strategy should be deemed to be
aggressive in nature and they are intended to be used by
persons who believe that aggressive trading suits their
personal risk profiles only
The
Performance of the Plan since inception:
We've included a graphic
below to help better demonstrate the performance of our
strategic plan. However, before we begin, please
recognize the following important statement (most offer this
in fine print, but we prefer to make it as clear as
possible):
PAST
PERFORMANCE IS ABSOLUTELY NO GUARANTEE OF FUTURE RESULTS.
Do not expect
us to perform like we have in the past. Our returns
will NEVER be exactly the same. Sometimes they may be
lower, sometimes they will be higher, and sometimes they
will be negative. Do not base your decisions to follow
this strategic plan on past performance. Use the tools
that we offer to formulate your own decisions, and use the
plan to help you understand what we think. Do not
follow the plan blindly. Consult your advisors before
you make any decisions. We are NOT Financial Advisors,
we do NOT know your risk tolerance and we do NOT tailor our
opinions to you or your objectives.
Here's the performance:
The strategic
plan began in August 2007 after the anomaly in the
Investment Rate Model (to read about the anomaly click the
Investment Rate link above):
Inception =
8.8.07
-
From 13700 – 12800 = +6.6% duration = 10 days
-
From 12800 - 14120 = +10.3%
duration = About 2
months
-
From 14120 – 13000 = +7.9%
duration = Just
over 1 month
-
From 13000 – 13500 = +3.8%
duration = about 2
weeks
-
From 13500 –
12180
=
+9.7%
duration = about 3
months
-
From
12180 –
?
=
? duration =
?
Total = 38.2%
Market Returns =
-8% as of 4.9.08
Outpacing the
market by 477.5%
as of 4.9.08
NOTE:
We offer specific stock trading ideas in association
with this plan too. Check our blogs in the trading
section for our current recommendations. Here's
the blog:
BLOG
The graphic below has not
been updated to reflect the recent bottom at 12180, but it
offers a good illustration of our ability to pick strategic
turning points in the market:
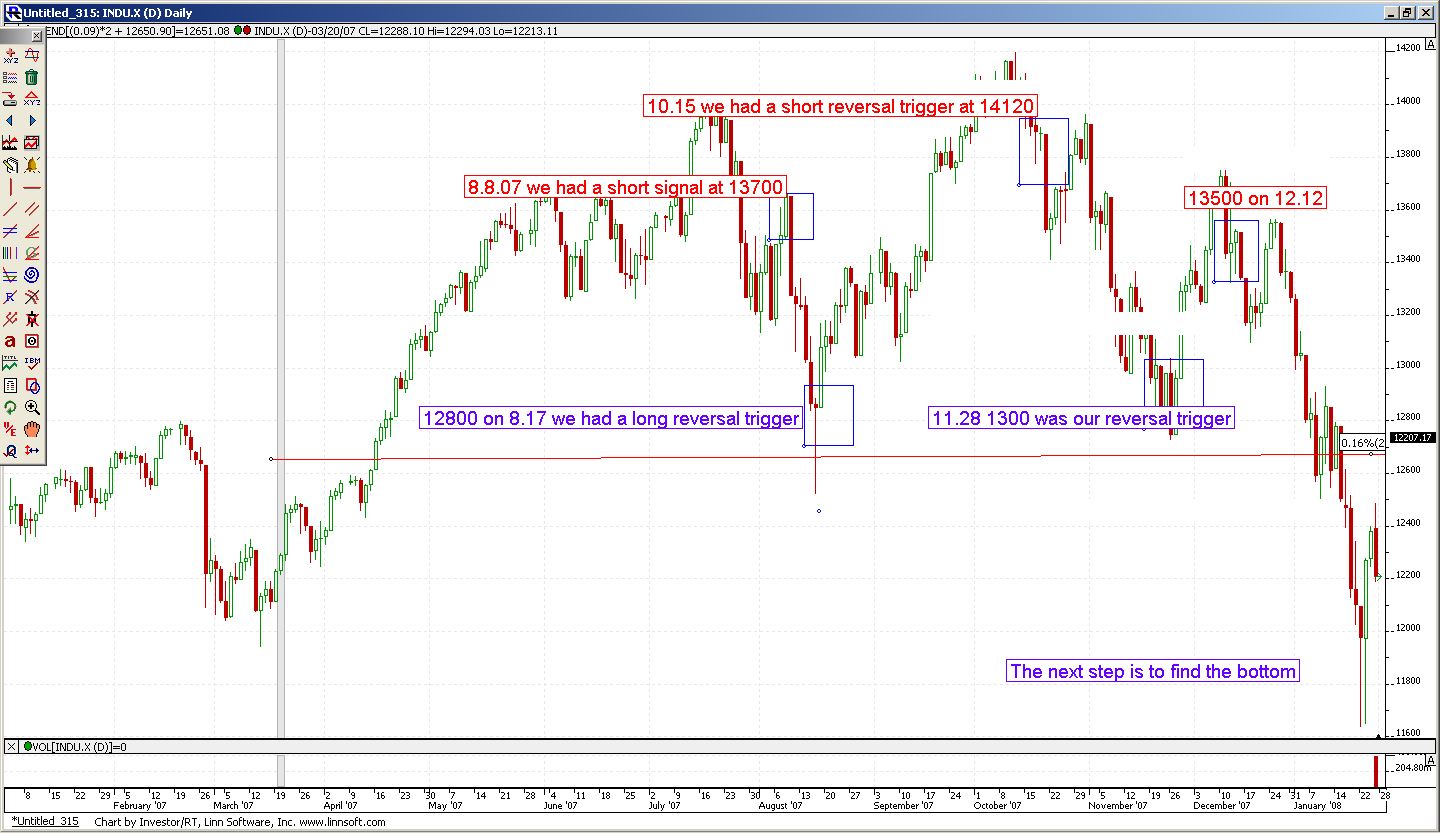
|