|
Our Individual
Stock Analysis is an integral part of our
trading strategies.
You can use our
analysis to help you identify trading
opportunities in specific stocks. They can be
used in conjunction with your current analysis,
or as an exclusive resource.
Topics:
-
Stocks we cover
-
Trading Reports
-
The Alerts
Viewer
-
Give it a try
Stocks we cover:
We cover 1300
different stocks, all traded on US Exchanges,
from all industries, sectors and Market Cap. We
probably follow the same stocks you do, but if
we don’t cover a stock that you are interested
in, our subscribers can request that the stock
be added to our Universe.
Our users can get a
real time trading report for any stock 24 hours
a day, in html (website), or .pdf (adobe
acrobat) format.
Trading Reports:
For each Stock we
follow we provide a detailed trading report.
These are the same reports that you might buy
through Reuters, Yahoo Finance, the WSJ Online,
or other financial portals.
Our members get
these reports for free.
The trading reports
that we provide include a concise technical
summary of the Stock in question. In addition
they provide detailed trading plans for near
term, mid term, and long term trades. The
trading reports do not incorporate fundamental
analysis. They also do not tell you whether to
buy, sell, or hold.
However, for
example, if you already know that you want to
buy a particular stock, these trading plans will
tell you exactly how to do it. They will tell
you where to enter the trade, where your price
target should be, and where to set your stop
loss.
The recommendations
to buy, sell or hold, come through our alerts
viewer, and the correlated stock selection
process associated with it. Before we talk
about that though, here’s an example of some of
the trading plans and technical summary data
that we provide in our reports.
|
Example from
9.17.07
BRCM
(BROADCOM CORP CL A)
Recently trading at: 34.85
September 17, 2007, 9:43
pm
ET
Refresh to update stock values
|
Trading
Plans
for BRCM
|
|
Day
Trading
Plan
|
|
Swing
Trading
Plan
|
|
Long
Term
Trading
Plan
|
|
|
|
Technical Summary |
| |
Near
Term |
Mid
Term |
Long
Term |
|
Directional Bias
|
Neutral |
Strong |
Neutral |
|
Parameter 1
|
34.81 |
33.43 |
22.88 |
|
Parameter 2
|
35.49 |
35.59 |
34.18 |
|
Parameter 3
|
36.23 |
37.75 |
46.30 |
|
Parameter 4
|
|
|
|
If you were to click on one of the Trading Plan links above you would
reeive trading plans for that
term. Here's an example of
the day trading plan for BRCM
for 9.17.07:
 |
|
Day
Trading
Plans
for BRCM |
September
17,
2007,
9:45 pm.
|
The slope of the
near term
analysis for
BRCM is strong,
the slope of the
mid term
analysis for
BRCM is neutral,
and the slope of
the longer term
analysis for
BRCM is neutral.
When combined
with the
Technical
Summary for BRCM,
this directional
analysis helps
us understand
how we should be
trading BRCM.
The following
trading plans
were derived
using this data
and they tell
you how to trade
the stock.
However, they do
not tell you
whether you
should buy or
short the stock.
You need to know
that before you
trade. If you do
not know
already, our
Market analysis
will help you
make long or
short decisions.
|
Technical
Summary:
, 22.88,
33.43,
34.18,
34.81,
34.85
,
35.59,
36.23,
37.75,
46.30,
Where
34.85 =
the
recent
price
|
(Long)
Resistance Plan:
Buy over
35.59, target
36.23, Stop Loss
@ 35.38
If 35.59 begins
to break higher,
the technical
summary data
will suggest a
buy of BRCM over
35.59, with an
upside target of
36.23. The data
also tells us to
set a stop loss
@ 35.38 in case
the stock turns
against us.
35.59 is the
first level of
resistance above
34.85 , and by
rule, any break
above resistance
is a buy signal.
In this case,
resistance 35.59
would be
breaking higher,
so a buy signal
would exist.
(Long) Support
Plan:
Buy near
34.81, target
35.59, Stop Loss
@ 34.6
The technical
summary data
tells us to buy
BRCM near 34.81
with an upside
target of 35.59.
This data also
tells us to set
a stop loss @
34.6 to protect
against
excessive loss
in case the
stock begins to
move against the
trade. 34.81 is
the first level
of support below
34.85 , and by
rule, any test
of support is a
buy signal. In
this case,
support 34.81
would be being
tested, so a buy
signal would
exist.
(Short)
Resistance Plan:
Short near
35.59, target
34.81, Stop Loss
@ 35.8
The technical
summary data is
suggesting a
short of BRCM if
it breaks below
35.59 with a
downside target
of 34.81. We
should have a
stop loss in
place at 35.8
though in case
the stock begins
to work against
the trade. By
rule, any break
below support is
a short signal.
In this case, if
resistance 35.59
is breaking
lower, a short
signal would
exist.
(Short) Support
Plan:
Short under
34.81, target
34.18, Stop Loss
@ 35.02
The technical
summary data is
suggesting a
short of BRCM if
it breaks below
34.81 with a
downside target
of 34.18. we
should also have
a stop loss in
place at 35.02
according to the
data. 34.81 is
first level of
support below
34.85 , and by
rule, any break
below support is
a short signal.
In this case, if
support 34.81 is
breaking lower,
a short signal
would exist.
Please Note: The Trading Plans listed above are based on real
time stock
prices. However,
as time goes by
prices change,
so please
refresh your
request if you
delay your
decisions,
because as the
Market moves,
these Trading
Plans may
change. They are
dynamic and they
change as the
market changes
so they are only
valid at or near
the time you
request them.
|
|
|
|
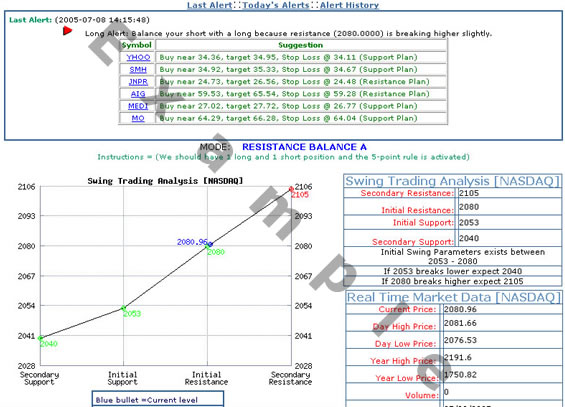
The Alerts Viewer
Our alerts viewer
is a Market Timing and Correlated Stock
Selection Tool. It is designed to alert you to
tests of support or resistance in the Market,
and to suggest trades to you which have a high
probability of correlating with Market action
from there. The alerts viewer offers you 5
stocks from which to choose from every time an
alert is fired. Each stock on the list also has
a detailed trading plan associated with it which
tells you where to buy, sell, and set your stop
loss (opposite for shorts).
Here’s an example:
let’s assume that a support level has been
tested and the alerts viewer has fired an alert
with 5 stocks (with complete trading plans).
The stocks were chosen based on their relation
to their respective support or resistance levels
as well, and they are ordered based on which are
closest, to furthest away from their respective
parameter. In this case, we are talking about a
support parameter, so the result would be a list
of stocks which are trading closest to their
respective support levels at the same time the
Market is trading near a support level of its
own. The list would give you 5 stocks with
trading plans which told you to buy the stock
near support (support is identified in the
plan), to target resistance (resistance is
identified) and where to place your stop loss
(to control your risk).
Each stock will be
relatively close to a trigger point. You just
need to pick one.
The alerts viewer
is a truly automated Market Timing and
Correlated Stock Selection tool. Here’s an
example:
Give it a try:
 |
|
Free 10
Day Trial - Platinum Membership
Sign Up Now
You can cancel at any time and won't be charged
All of our services are
included in the Free Trial.
Instructions:
- Click the Sign Up Link below to start your Free Trial
- Record your username and password.
- Use the Platinum Login to enter the Clubsite.
- Your Free Trial lasts for 10 Calendar Days
- The service is $299 per month after 10 Days.
|
|
|