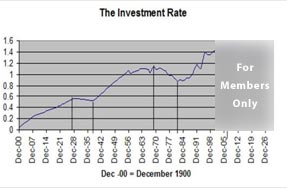
The Investment Rate
The Most Accurate Leading Stock Market and Economic Indicator ever developed.
I Answer Questions
via 1-1 Live Chat
Access to The Investment Rate:
The Investment Rate, along with the other proprietary reports offered by our firm, can be accessed through Reuters, in "Buy and Hold is Dead", and regular updates are available to subscribers of Stock Traders Daily. Start by reading the synopsis on this page, and then sign up for a free trial to learn more today..
Available directly through Reuters for institutional accounts
The Investment Rate:
The Investment Rate is a proprietary model. It has been able to predict major Economic and Stock Market cycles with precision since 1900. It predicted the Great Depression, the Stagflation period of the 1970's, and the up-trends in between. We have recently been able to adapt this longer term model to identify shorter term cycles too. Both the longer term model, and the periodic observations are available to our subscribers.
The Investment Rate explains the reason for the weakness (it is not over), the duration of this down period, and the timing of a sustainable recovery. Best of all, it does this while removing noise, fear, and emotion from the evaluation process. That makes it easy to use, and even easier to understand. Economic cycles are all about people, and the Investment Rates leverages this grass-roots approach to bring Economic and Market analysis back to their core.
Because it is the longest longer - term analysis available, The Investment Rate is always the first step in evaluating business decisions and investment decisions for all asset classes. It comes before Random Walk Theory, or Dow Theories are applied. The IR is a demand - side analysis that measures the rate of change in the amount of New Money available for investment into our economy over time. It is not specific to the Stock Market, although many of those new investable dollars find their way to the Market eventually.
New money drives the Market, not old money. The Market cannot move to new highs by churning money that has already been invested. New investment dollars must come into the Market in order for it to move higher. The Investment Rate measures this precisely. For example, in 2008, all asset classes were declining. The Investment Rate explains why.
In turn, the chart of the Investment Rate identifies trends in overall demand ratios, and that allows us to identify major economic cycles as well. Because new money drives the Market, and because this indicator shows us the rate of change in the amount of new money in advance, The Investment Rate also identifies major shifts in the Market before they occur.
After using this tool, current conditions and the associated recovery probabilities will become obvious.
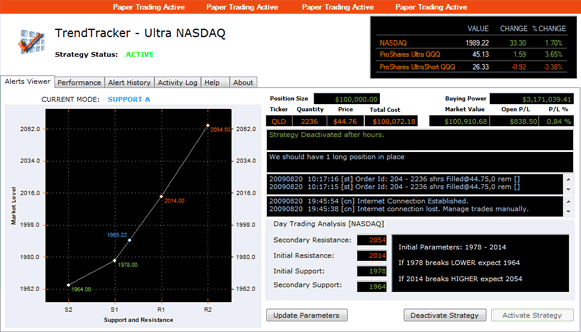
We also offer proactive strategies in conjunction with this tool, but the Investment Rate itself is a fundamental demand-side analysis that focuses on people, not complex econometric data variables.
Keep it Simple, and these conditions will be easy to understand.
Our challenge to everyone: stop listening to the noise for a short while. Review the Investment Rate without distraction, and embrace the simplicity and accuracy of the Model. It can and should be used every time business or investment decisions are made.


