| Estimated Duration:
1 Day
Notes: You should know how to identify
trading triggers for Swing Trades after this lesson
(The only differences between swing trading and day
trading triggers are highlighted in red, otherwise they
are the same).
Understanding
how to identify trading triggers for Swing Trades using
our system
This lesson is designed to teach you how to find Swing
Trades using our system. This lesson will incorporate
the instructions already provided in lessons 1-5 and
it should allow you to start to acquaint yourself with
the efficacy of our system.
All of our Trading Recommendations are based on appropriate
Market Timing. We NEVER trade unless the Market is telling
us to do so. Therefore, in order to find Swing Trades
we must first follow these simple steps:
- We first must know when to trade
- We then need to know what to trade
- We then need trading plans for those trades.
- And finally we need to execute our trades.
You'll be happy to know that....
- We tell you when to trade
- We tell you what to trade
- We give you trading plans for those trades.
- But you need to execute your own trades.
All you need to do is to watch the Market, and to execute
your trades when you are alerted to do so. Let's take
this step-by-step:
We first need to know when to execute our Swing Trades.
This is exactly what the Swing Trading Parameters provide
us. These Parameters are found on the Swing Trading
Analysis Page referenced in the previous lesson. Remember
the link: http://www.stocktradersdaily.com/clubsite/Club/
In the Swing Trading Analysis Page specific support
and resistance Parameters are provided to you. When
one of those Parameters is tested, a trading signal
occurs. When a trading signal occurs, we are alerted
to execute trades.
Let's use a specific example. The following Parameters
are provided in a typical format; take a look:
- Initial Swing Trading Parameters exist between 1900
- 1940
- If 1900 breaks lower expect expect 1800
- If 1940 breaks higher expect 2023
- Otherwise expect 1900 - 1940 to hold
From there Parameters we can assume a few things:
- We expect to hold every swing trade for more than
1 day. We have some occurrences where a support level
and a resistance level for Swing Trades will be tested
during the same session. This will happen, but for
the most part, we should expect to hold every swing
trade for more than 1 day.
- We can assume that the Market was somewhere between
initial support and initial resistance when these
Parameters were published. This lies somewhere between
1900 and 1940 in this example.
- We can assume that the Market will either head higher
and test resistance first, or it will decline towards
support. In either case we need a plan
TRADING PLANS
There are 2 types of plans. Each of the plan types
have a series of dynamic possibilities, which should
be rather obvious. These possibilities will be discussed
in detail for each plan type. Here are the initial plan
types:
- Support Plans
- Resistance plans.
If the support level is tested first the Market could
either hold support, or support could break. If the
resistance level is tested first, resistance could either
hold or break as well. However, upon each test, and
each subsequent break, trading signals occur. Let's
take a look at the support plans:
If support is tested first a trading trigger occurs
which recommends a long trade. This is SUPPORT MODE.
Support Mode occurs as soon as a support level is tested.
By rule, an official test of support comes when the
Market is within 3 points of stated support.
Once in Support Mode, 2 things can happen.
- Support can hold.
- Support can break.
If Support holds, the trading plan is simple:
- Buy near support, target resistance. In our example
that would be: Buy near 1900, target 1940. (Near means
within 3 points, so 1903).
If support breaks a second trading trigger occurs.
- If a level of support breaks, a trading trigger
comes which recommends a short position for balance.
Balance means that there is 1 open long position and
1 open short positions at the same time. Balance is
required because the Market is threatening a break
of support in this instance. When balance is required
after a support level is tested, we consider the Market
to have triggered SUPPORT BALANCE MODE.
- Immediately after the Market gets into Support Balance
Mode the 5-point rule should be implemented. This
tells us to overweight longs or shorts if the Market
moves 5 points away from our Parameter. Here's an
example using the sample Parameters above: Let's assume
the Market tests support at 1900 first. This would
mean that a long signal occurred. However, let's assume
that 1900 broke slightly lower. This would require
balance, and the 5-point rule would be implemented.
Because 1900 was our Parameter, if the Market moved
to 1905 after having balance we would overweight longs
(2 longs and 1 short). However, if the Market moved
down instead and breached 1895 we would have a signal
to overweight shorts (2 shorts 1 long).
If we are in an overweight short position (2 shorts
1 long) we are considered to be in a SUPPORT BALANCE
SHORT MODE. In this mode we should be expecting the
shorts that were triggered to work for us as the Market
declines to the next lower level of support. In our
example we would have a trading plan as follows: Overweight
shorts under 1900 target 1800.
If we are in an overweight long position (2 longs 1
short) we are considered to be in a SUPPORT BALANCE
LONG MODE. In this mode we should be expecting the Market
to increase to the next level of resistance. In our
example that would be 2023. In our example we would
have a trading plan as follows: Overweight longs above
1900 with a target of 1940.
In support balance short mode 2 things can
happen:
- The Market can test the next level of support. If
the Market tests the next level of support, our downside
target will have been reached and we should close
all trades and start over. We would expect to make
money from 2 shorts and we should expect to have had
1 stop from the long which was initiated for balance.
- The Market could turn higher. If the Market turns
higher and triggers the 5 points rule on the upside
too (after having already done so on the downside),
the Market goes into SUPPORT BALANCE SHORT LONG MODE
In Support balance short long mode the Market will
either decline to the next lower stated levels of support,
or the market will increase to the next higher level
of resistance. In either case, no more positions will
be initiated until one or more of the current positions
are closed. In this instance we would have 2 longs and
2 shorts at once. Therefore there would be 4 trades
called at the same time. This is our position limit.
We will never have more than 4 positions called at once.
Expected results after being in Support Balance Short
Long Mode:
- If the next level of support is tested first we
would expect to lock in gains from the shorts that
were in place, but we could also expect the stops
that occurred from the 2 longs that were in place
to offset those gains somewhat.
- If the next level of resistance is tested first
we would expect to lock in gains from the 2 long positions
that were in place, but we could also expect to have
those increases offset somewhat from the 2 shorts
that were in place for balance.
- In either case, after these positions are closed,
we should look for new trading ideas based on the
Parameters that have been provided for that session.
Take a look at this graphic for an easy to understand
interpretation:
In support balance long mode 2 things can happen
as well:
- The Market can test the next level of resistance.
If the Market tests the next level of resistance,
our upside target will have been reached and we should
close all trades and start over. We would expect to
make money from 2 longs and we should expect to have
had 1 stop from the short which was initiated for
balance.
- The Market could turn lower instead. If the Market
turns lower and triggers the 5 points rule on the
downside too (after having already done so on the
upside), the Market goes into SUPPORT BALANCE
LONG SHORT MODE
In Support balance long short mode the Market will
either decline to the next lower stated levels of support,
or the market will increase to the next higher level
of resistance. In either case, no more positions will
be initiated until one or more of the current positions
are closed. In this instance we would have 2 longs and
2 shorts at once. Therefore there would be 4 trades
called at the same time. This is our position limit.
We will never have more than 4 positions called at once.
Expected results after being in Support Balance Long
Short Mode:
- If the next level of support is tested first we
would expect to lock in gains from the shorts that
were in place, but we could also expect the stops
that occurred from the 2 longs that were in place
to offset those gains somewhat.
- If the next level of resistance is tested first
we would expect to lock in gains from the 2 long positions
that were in place, but we could also expect to have
those increases offset somewhat from the 2 shorts
that were in place for balance.
- In either case, after these positions are closed,
we should look for new trading ideas based on the
Parameters that have been provided for that session.
- The 2 graphs below may help you better understand
these concepts. The first graphic shows you the breakdown
of Support Balance Short Mode. The Second shows a
breakdown of Support Balance Long Mode:
Take a look at this graphic for an easy to understand
interpretation:
The illustrations above walk you through support mode.
However, we still need to address resistance mode. Basically
this will be the opposite of support mode.
If resistance is tested first a trading trigger occurs
which recommends a short trade. This is RESISTANCE MODE.
Resistance Mode occurs as soon as a resistance level
is tested. By rule, an official test of resistance comes
when the Market is within 3 points of stated resistance.
Once in Resistance Mode, 2 things can happen.
- Resistance can hold.
- Resistance can break.
If Resistance holds, the trading plan is simple:
- Short near resistance, target support. In our example
that would be: Short near 1940, target 1900. (Near
means within 3 points, so 2037).
If resistance breaks a second trading trigger occurs.
- If a level of resistance breaks, a trading trigger
comes which recommends a long position for balance.
Balance means that there is 1 open short position
and 1 open long position at the same time. Balance
is required because the Market is threatening a break
of resistance in this instance. When balance is required
after a resistance level is tested, we consider the
Market to have triggered RESISTANCE BALANCE MODE.
- Immediately after the Market gets into Resistance
Balance Mode the 5-point rule should be implemented.
This tells us to overweight longs or shorts if the
Market moves 5 points away from our Parameter. Here's
an example using the sample Parameters above: Let's
assume the Market tests resistance at 1940 first.
This would mean that a short signal occurred. However,
let's assume that 1940 broke slightly higher. This
would require balance, and the 5-point rule would
be implemented. Because 1940 was our Parameter, if
the Market moved to 1945 after having balance we would
overweight longs (2 longs and 1 short). However, if
the Market moved down instead and breached 1935 we
would have a signal to overweight shorts (2 shorts
1 long).
If we are in an overweight short position (2 shorts
1 long) we are considered to be in a RESISTANCE BALANCE
SHORT MODE. In this mode we should be expecting the
shorts that were triggered to work for us as the Market
declines to the next lower level of support. In our
example we would have a trading plan as follows: Overweight
shorts under 1940 target 1900.
If we are in an overweight long position (2 longs 1
short) we are considered to be in a RESISTANCE BALANCE
LONG MODE. In this mode we should be expecting the Market
to increase to the next level of resistance. In our
example that would be 2045. In our example we would
have a trading plan as follows: Overweight longs above
1940 with a target of 2023.
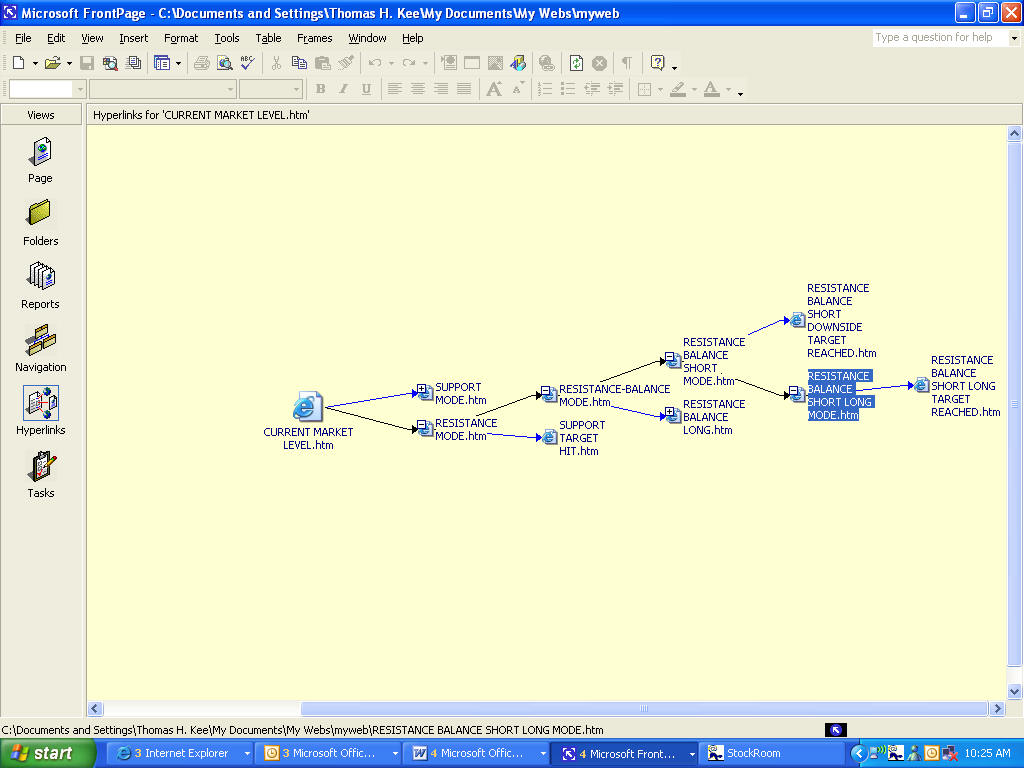
In resistance balance short mode 2 things can
happen:
- The Market can test the next level of support. If
the Market tests the next level of support, our downside
target will have been reached and we should close
all trades and start over. We would expect to make
money from 2 shorts and we should expect to have had
1 stop from the long which was initiated for balance.
- The Market could turn higher. If the Market turns
higher and triggers the 5 points rule on the upside
too (after having already done so on the downside),
the Market goes into RESISTANCE BALANCE SHORT
LONG MODE
In Resistance balance short long mode the Market will
either decline to the next lower stated levels of support,
or the market will increase to the next higher level
of resistance. In either case, no more positions will
be initiated until one or more of the current positions
are closed. In this instance we would have 2 longs and
2 shorts at once. Therefore there would be 4 trades
called at the same time. This is our position limit.
We will never have more than 4 positions called at once.
Expected results after being in Resistance Balance
Short Long Mode:
- If the next level of support is tested first we
would expect to lock in gains from the shorts that
were in place, but we could also expect the stops
that occurred from the 2 longs that were in place
to offset those gains somewhat.
- If the next level of resistance is tested first
we would expect to lock in gains from the 2 long positions
that were in place, but we could also expect to have
those increases offset somewhat from the 2 shorts
that were in place for balance.
- In either case, after these positions are closed,
we should look for new trading ideas based on the
Parameters that have been provided for that session.
Take a look at this graphic for an easy to understand
interpretation:
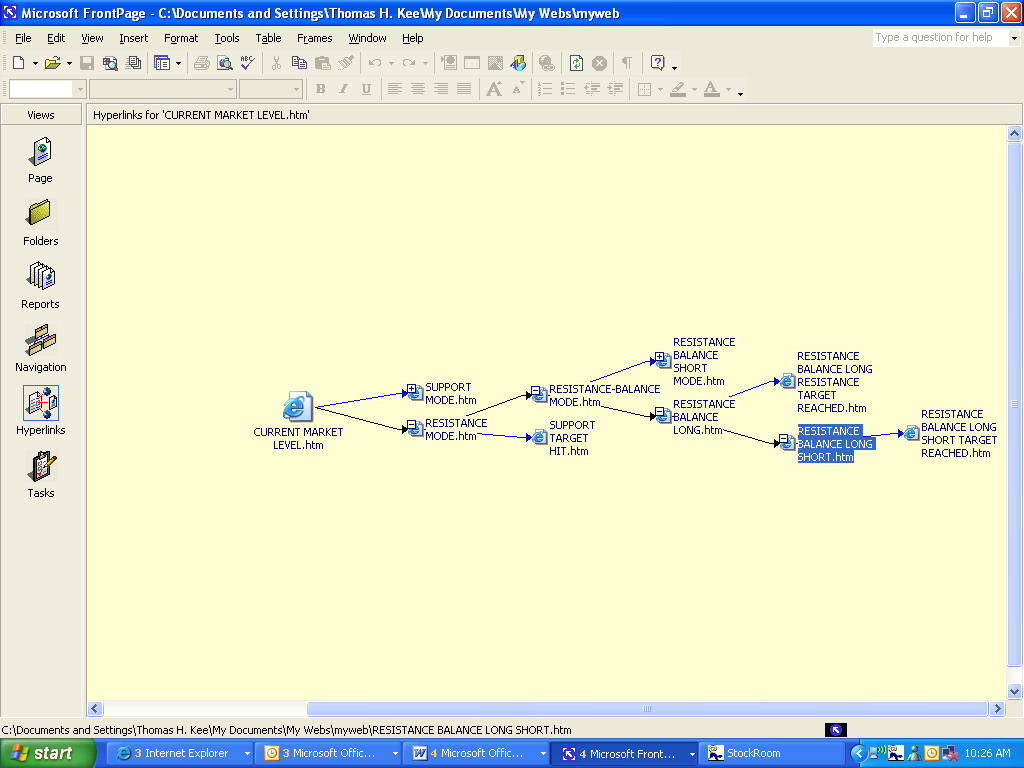
In resistance balance long mode 2 things can
happen as well:
The Market can test the next level of resistance. If
the Market tests the next level of resistance, our upside
target will have been reached and we should close all
trades and start over. We would expect to make money
from 2 longs and we should expect to have had 1 stop
from the short which was initiated for balance.
The Market could turn lower instead. If the Market
turns lower and triggers the 5 points rule on the downside
too (after having already done so on the upside), the
Market goes into RESISTANCE BALANCE LONG SHORT
MODE
In Resistance balance long short mode the Market will
either decline to the next lower stated levels of support,
or the market will increase to the next higher level
of resistance. In either case, no more positions will
be initiated until one or more of the current positions
are closed. In this instance we would have 2 longs and
2 shorts at once. Therefore there would be 4 trades
called at the same time. This is our position limit.
We will never have more than 4 positions called at once.
Expected results after being in Resistance Balance
Long Short Mode:
If the next level of support is tested first we would
expect to lock in gains from the shorts that were in
place, but we could also expect the stops that occurred
from the 2 longs that were in place to offset those
gains somewhat.
If the next level of resistance is tested first we
would expect to lock in gains from the 2 long positions
that were in place, but we could also expect to have
those increases offset somewhat from the 2 shorts that
were in place for balance.
In either case, after these positions are closed, we
should look for new trading ideas based on the Parameters
that have been provided for that session.
Take a look at this graphic for an easy to understand
interpretation:
This lesson tells you when trades are triggered. The
next lesson will tell you how to find trades once a
trigger occurs.
If you do not understand when trades are triggered,
please review this lesson.
|